Figure 1.
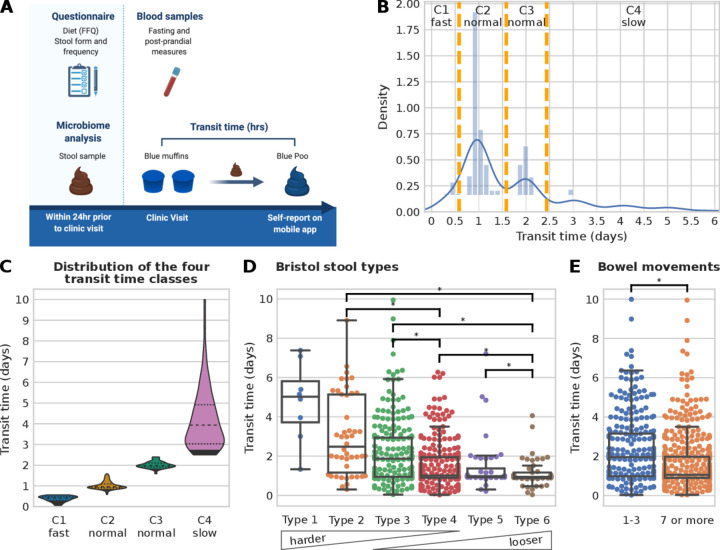
Gut transit time estimation in the PREDICT 1 cohort. (A) PREDICT 1 study design with focus on gut transit time (created by Biorender.com). (B) Histogram of the gut transit time distribution with orange vertical lines showing the boundaries of the four classes (C1: fast transit time; C2 and C3: normal gut transit time; C4: slow gut transit time). (C) Violin plots of the four gut transit time classes showing an average of 0.38, 1.02, 2.01 and 4.21 days for C1, C2, C3 and C4, respectively. An alternative visualisation using a semi-log scale is available in online supplemental figure 1A. (D) Distribution of gut transit time with respect to Bristol stool types and (E) with respect to the reported number of bowel movements in the week prior to the start of the PREDICT 1 study. Asterisks denote statistically significant differences according to the Mann-Whitney U test with a p value<0.01 and categories with less than 10 samples were not tested for significance.

