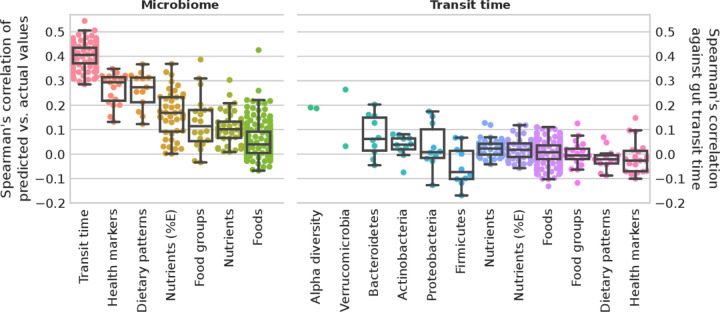
Figure 4.
Microbiome profiles and gut transit time in predicting health markers and diet. Microbiome. Box plots of microbiome species relative abundances used to train a machine learning (ML) regression task to predict gut transit time (100-folds shown) and median for each marker for health markers, dietary patterns, nutrients (adjusted by energy intake and not), food groups and single foods. Gut transit time appears to be the better predictable outcome using microbiome species profiles than health markers and diet. Gut transit time. Box plots of the correlation of gut transit time with microbiome-related and diet-related markers. Gut transit time and microbiome-related markers include two alpha diversity measures (richness and Shannon), and up to the 10 most abundant species for each of the top five phyla according to their average relative abundances. Gut transit time and diet-related markers include single nutrients and energy-adjusted nutrients, single foods and foods organised into food groups according to the Plant-based Dietary Index, dietary indices and the 19 health markers used in the previous work35 to define the microbial cardiometabolic health signature. Box plots were removed for markers with less than 10 points.

