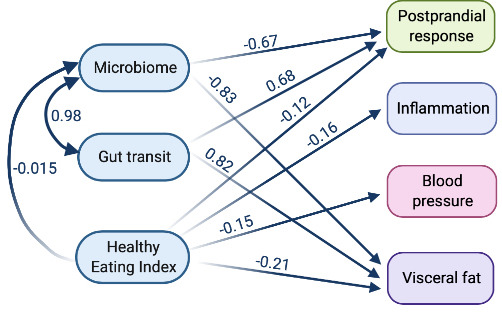
Figure 5.

Structural equation model to determine the relationship between the microbiome, gut transit time, diet and health measures. Blood pressure (mean of systolic and diastolic), inflammation (mean of fasting GlycA and IL-6), postprandial response (mean of peak glucose and triglyceride concentrations) and visceral fat. Model definitions, with boxes representing manifest nodes and arrows indicating regression coefficients pointing towards an outcome of regression (standardised beta value mentioned on each arrow only for significant associations (p value<0.05) except the link among exposures) (created by Biorender.com).
