
Figure 1. Tracing Tbr2-expressing retinal neurons.
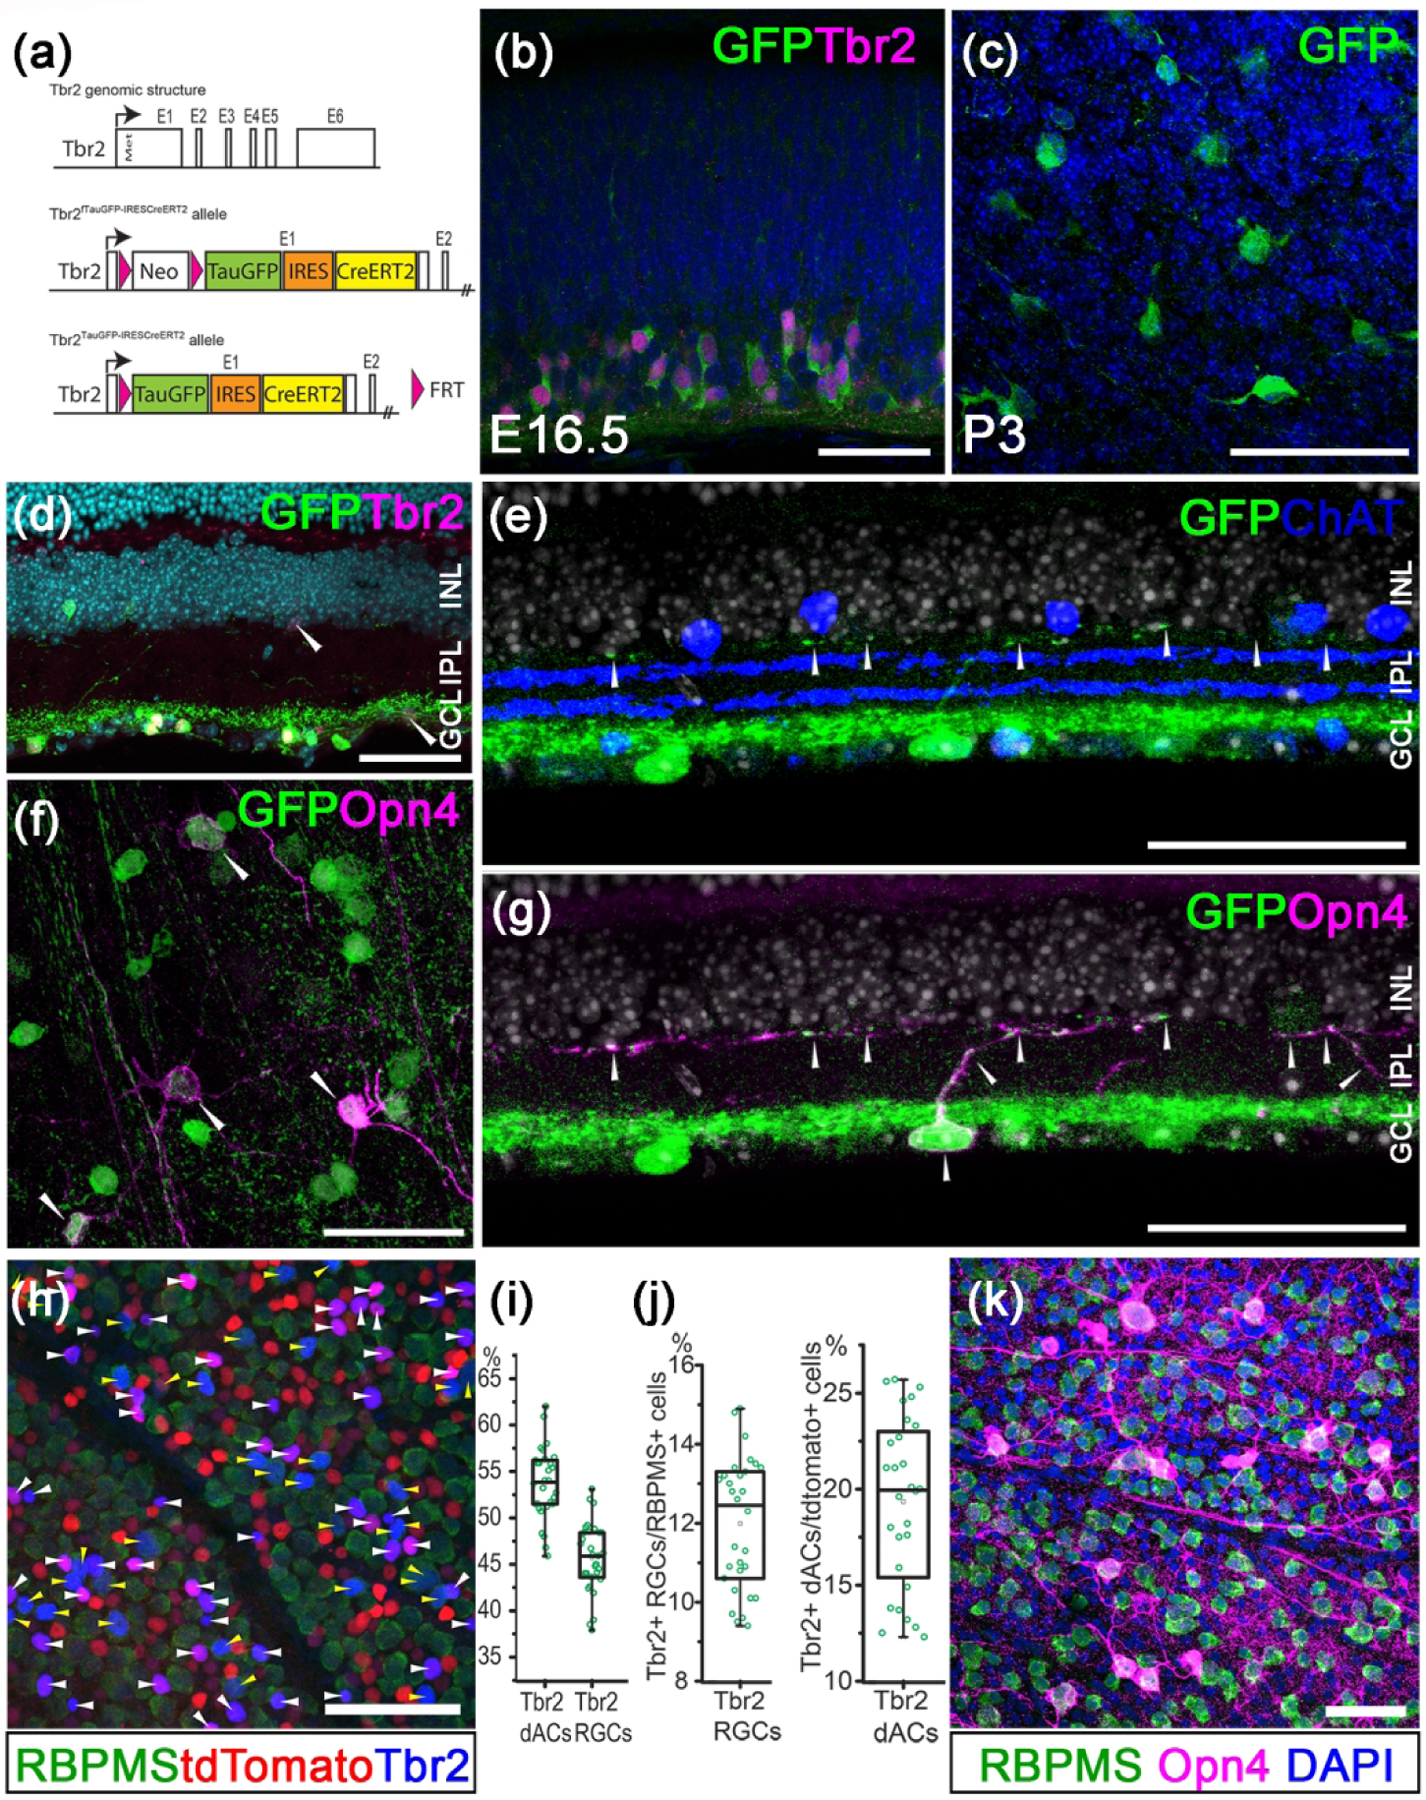
(a) Genomic structure of Tbr2 locus and the engineered allele in the Tbr2TauGFP-IRESCreERT2 mouse. (b) Double immunofluorescent staining showing Tbr2 expression (magenta) in Tbr2-driven GFP+ cells (green) in an E16.5 Tbr2TauGFP retinal section. (c) Representative immunofluorescent image showing Tbr2-driven GFP+ cells (green) in a P3 Tbr2TauGFP retinal flatmount. (d) Immunofluorescent image showing Tbr2 expression (magenta) in Tbr2-driven GFP+ cells (green) in a Tbr2TauGFP retinal section. (e) Fluorescent image of a Tbr2TauGFP retinal section showing dense Tbr2-driven GFP signal (green) in ON sub-laminae below the cholinergic ChAT bands (blue) in IPL. Note that GFP signal is separated from the ON ChAT band. (f) Representative co-immunofluorescent image showing melanopsin expression (magenta) in Tbr2-driven GFP+ cells (green) in a P30 Tbr2TauGFP retinal flatmount. (g) Double immunofluorescent staining showing melanopsin expression (magenta) in Tbr2-driven GFP+ cells (green). (h) Co-immunofluorescent staining on a Slc32a1Cre:Ai9 retinal flatmount showing Tbr2 expression (blue) with RBPMS+ RGCs (yellow arrowheads) or tdTomato+ RBPMS− dACs (white arrowheads). (i) Relative abundance of Tbr2+ RGCs and dACs described in G. (j) Relative abundance of Tbr2+ RGCs within the entire RGC population (left) and Tbr2+ dACs within the entire dAC population. (k) Co-immunofluorescent staining on a WT retinal flatmount showing melanopsin expression (magenta) with RBPMS+ RGCs (green). ChAT: cholinergic acetyltransferase. GCL: ganglion cell layer. INL: inner nuclear layer. IPL: inner plexiform layer. Scale bars: 50 μm (b-k).