
Figure 2. Identification of Tbr2+ RGCs and dACs.
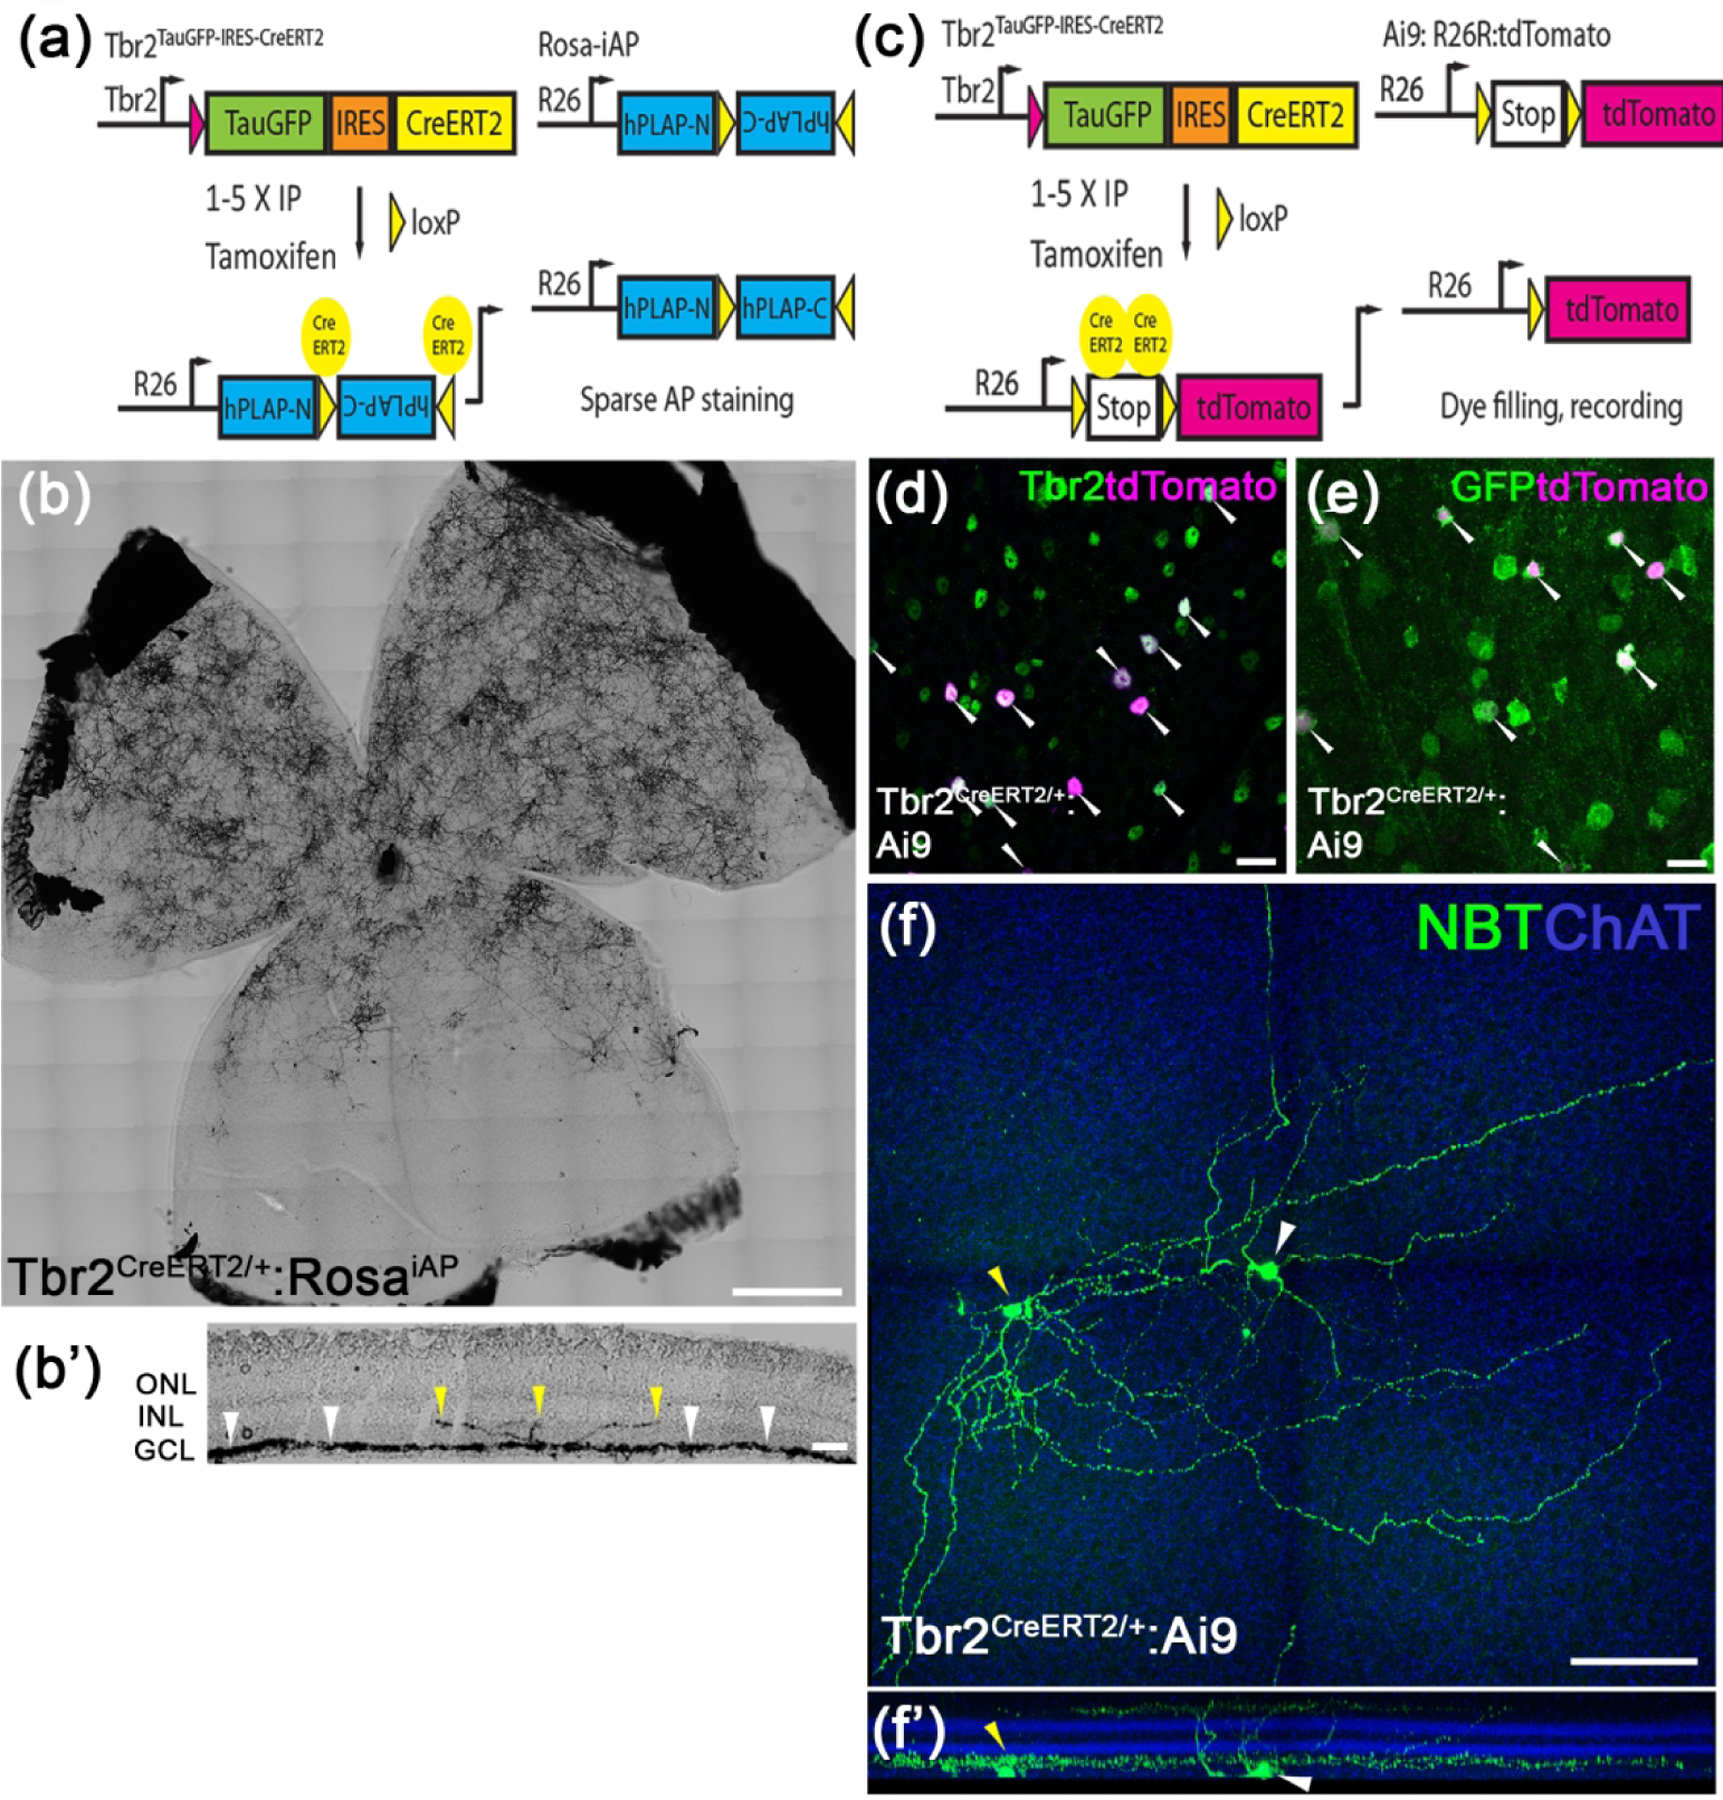
(a) The genetic sparse labeling system in the Tbr2CreERT2:RosaiAP mouse line. (b, b’) Representative AP staining from a flat-mounted P30 Tbr2CreERT2:RosaiAP retina showing intense AP+ Tbr2-expressing retinal neurons (b) and the location where their terminal dendrites stratify in IPL (b’). (c) The fluorescent labeling system of Tbr2+ neurons in the Tbr2CreERT2:Ai9 mouse line. (d, e) Co-immunofluorescent staining on a Tbr2CreERT2/+:Ai9 retinal flatmount showing tdTomato expression (magenta, white arrowheads) with Tbr2 (green) (d) or Tbr2-driven GFP (e). (f, f’) Representative images showing the morphology of a Tbr2-expressing displaced amacrine cell (yellow arrowhead) and a nearby RGC (white arrowhead) revealed by filled neurobiotin (f) and the location where their terminal dendrites stratify in reference to ChAT bands in IPL (f’). NBT: neurobiotin. ChAT: cholinergic acetyltransferase. Scale bars: 500 μm (b), 20 μm (d, e), 100 μm (f).