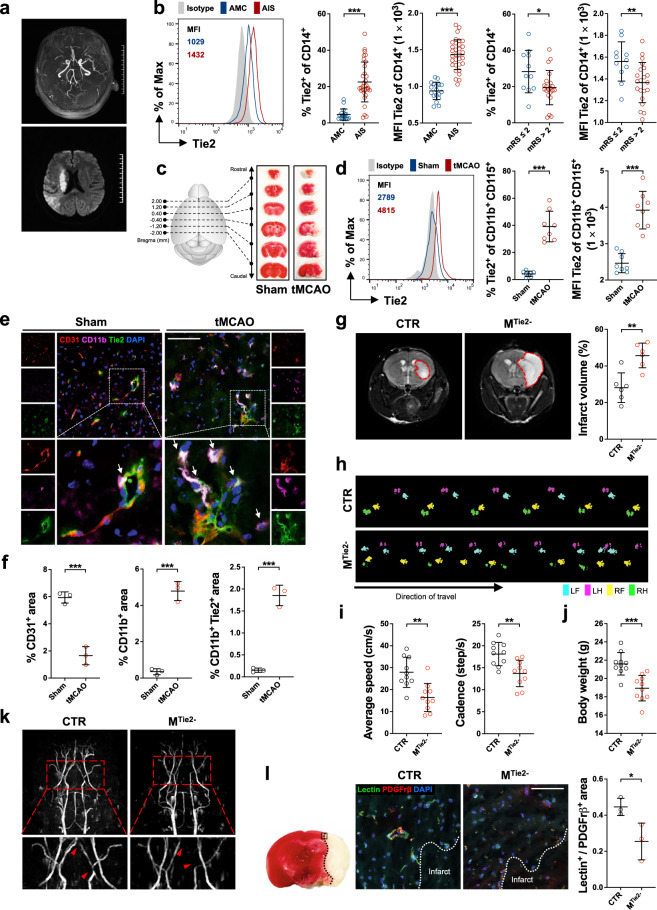
Fig. 1.
Tie2-expressing monocytes/macrophages promote revascularization in ischemic brain. a Representative magnetic resonance imaging (MRI) scans of a recruited patient taken with magnetic resonance angiography (MRA; upper) and coronal high-b-value diffusion-weighted imaging (below), showing severe stenosis and occlusion of the right middle artery of the patient and extensive white matter hyperintensities. b Flow cytometric analysis of blood samples from 32 acute ischemic stroke (AIS) patients and 18 age-matched controls (AMCs). A representative histogram plot of Tie2 staining in circulating CD14+ monocytes is determined with mean fluorescence intensity (MFI) and statistical analysis of Tie2 expression in AIS patients compare with AMCs. Statistics in AIS outcomes by mRS scores, ≤2 (11 patients) vs. >2 (21 patients). Each dot in the plots corresponds to one participant. c Representative 2,3,5-triphenyltetrazolium chloride (TTC) staining images from sham- and transient middle cerebral artery occlusion (tMCAO)-treated mice. d Tie2 expression in CD11b+/CD115+ circulating monocytes was analyzed by flow cytometry in Sham and tMCAO groups mice at 24 h post surgery. Each dot in the plots corresponds to one mouse (n = 8 per group). e Immunofluorescence staining in the brain ischemic area of tMCAO and sham mice at 24 h after surgery. CD11b+/Tie2+ TEM cells (arrowheads) surround the remaining CD31+ endothelial cells. Scale bars, 100 µm. f Morphometric analysis of TEMs in the cerebral obstruction zone of tMCAO and sham mice with Caliper InForm software. Each dot in the plots corresponds to one mouse (n = 3 per group). g Typical T2-weighted images of the cerebral lesion at bregma from MTie2− and CTR mice at 24 h post tMCAO. Statistical analyses showed quantitative results of MRI. Each dot in the plots corresponds to one mouse (n = 6 per group). h Gait status of MTie2− and CTR mice was assessed at 7 days after tMCAO using the CatWalk system. (LF: left front paw; LH: left hind paw; RF: Right front paw; RH: right hind paw). The average speed, cadence (i), and bodyweight (j) of both MTie2− and CTR mice were recorded, and mean values were calculated at 7 days after tMCAO (n = 10 per group). k MRA was applied to observe the status of functional vessels in mice 24 h post tMCAO. Scans in MTie2− mice showed more obvious occlusion and stenosis in the right artery (arrowheads) compared with CTR. l The boxed area in the TTC-stained brain section indicates the area where representative photomicrographs were taken. Double immunostaining of Lectin (green) with PDGFrβ (red) in the peri-infarct area of the mouse brain from CTR and MTie2− mice at 24 h post tMCAO is shown in the merged image. Scale bars, 100 μm. The ratio of functional capillaries/pericytes was analyzed by Caliper InForm software. Each dot corresponds to one mouse (n = 3 per group). All data were statistically analyzed by unpaired t test (mean ± SD; *p < 0.05; **p < 0.01; ***p < 0.001)

