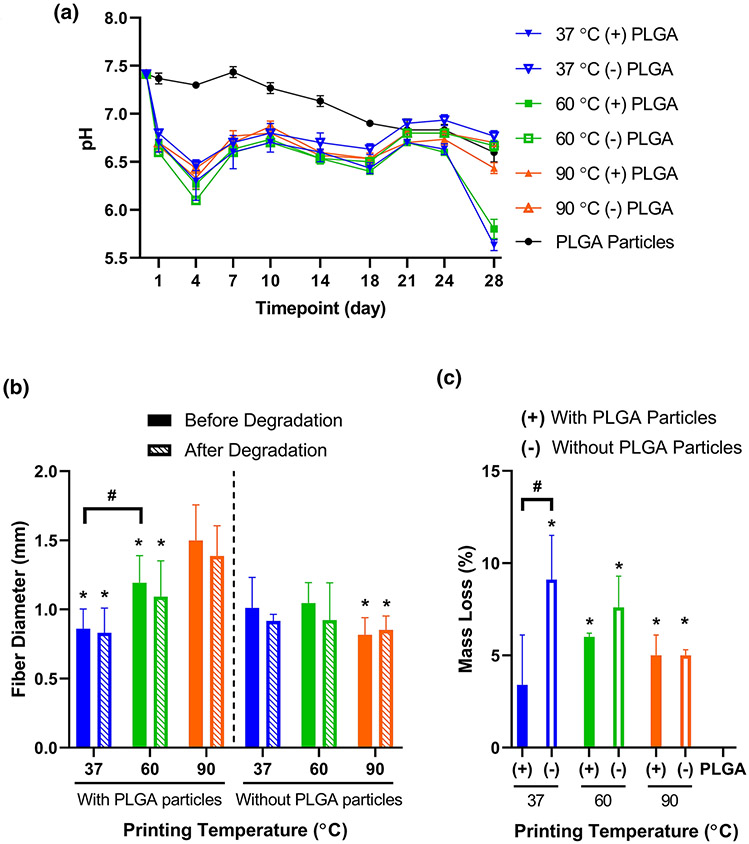
Figure 3. Characterization of degradation for 3D printed PPF-based fibers.
A) pH of degradation buffer during incubation with 3D printed PPF-based fibers or PLGA particles, with replacement of buffer at each measurement timepoint. Data are reported as mean ± standard deviation for n = 3 samples. Statistical comparisons can be found in Supplementary Table S1. B) Average diameters of ten randomly selected fibers from each material formulation and printing temperature, prior to or following 28 days of incubation in degradation buffer. * above a data bar indicates significant difference (p < 0.05) relative to the corresponding particle-containing 90 °C group, with pre-degradation groups compared to the pre-degradation particle-containing 90 °C group, and post-degradation groups compared to the post-degradation particle-containing 90 °C group; # above a line between data bars indicates significant difference (p < 0.05) between those groups. C) Percentage of sample mass loss during the 28-day degradation study. Data are reported as mean ± standard deviation for n = 3 samples. * above a data bar indicates significant difference (p < 0.05) relative to the PLGA particle-only control group; # above a line between data bars indicates significant difference (p < 0.05) between those groups. (+) or (−) refers to printed fiber groups that either contain or do not contain PLGA particles, respectively.

