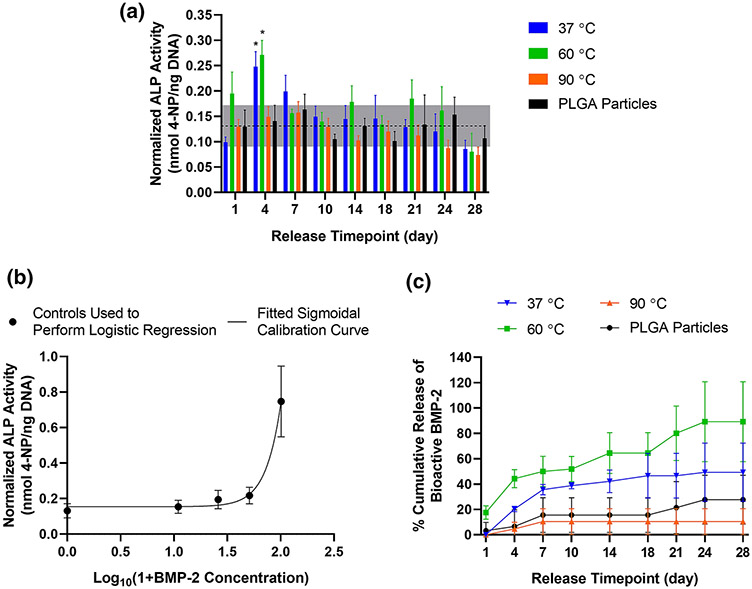
Figure 4. Cellular bioactivity assay of ALP upregulation.
A) ALP activity normalized by DNA content for W-20-17 cells. Horizontal dotted line indicates averaged value for control cells incubated in culture medium without added growth factor; grey box represents ± standard deviation of these controls cells’ values. * denote significant upregulation (p < 0.05) from the averaged value for control cells as determined by unpaired t-tests. B) Calibration curve derived from four-point logistic regression which correlates normalized ALP activity of cells incubated with known concentrations of bioactive BMP-2 in ng/mL. C) Cumulative release profile of bioactive BMP-2 calculated from normalized ALP measurements for 3D printed constructs and PLGA delivery vehicles. Data are reported as mean ± standard deviation for n = 3-4 samples. Legends refer to printing temperature or non-printed PLGA particle control.

