Abstract
Background
The immune microenvironment plays an essential role in osteosarcoma (OSs); however, differences in immune-related long non-coding ribonucleic acids (irlncRNAs) in children with localized OSs and metastatic OSs have not yet been investigated.
Methods
The clinical data and the transcriptome of OSs were obtained from the Therapeutically Applicable Research to Generate Effective Treatments (TARGET) database, and the immune-related genes were derived from the imported dataset. The correlations between immune-related genes and lncRNAs were examined. Next, the differential expressions of the irlncRNA pairs (IRLPs) in localized OSs and distant metastatic OSs were analyzed, and a prognostic model was constructed based on the significant differentially expressed IRLPs. We also analyzed the association between the IRLPs’ signature risk score and the infiltration of the immune cells. Finally, we investigated the correlation between risk score and drug resistance.
Results
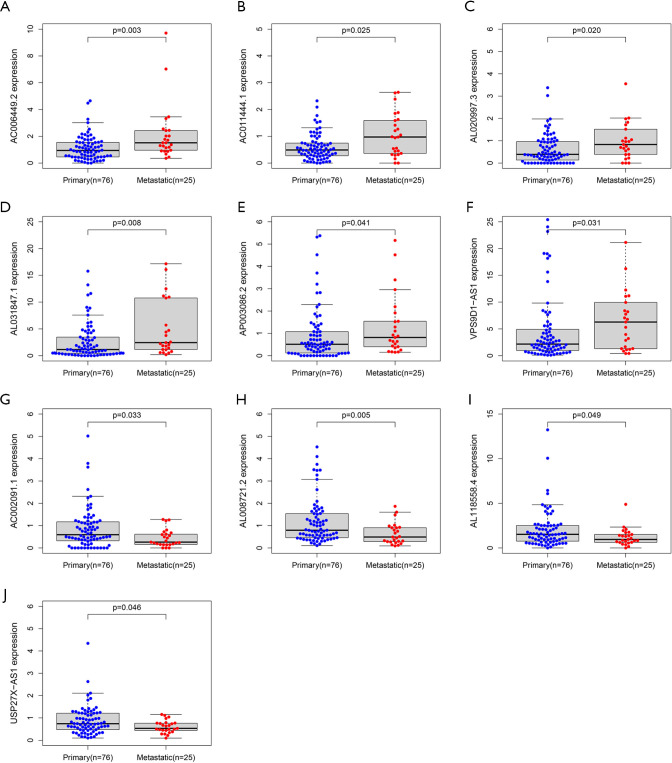
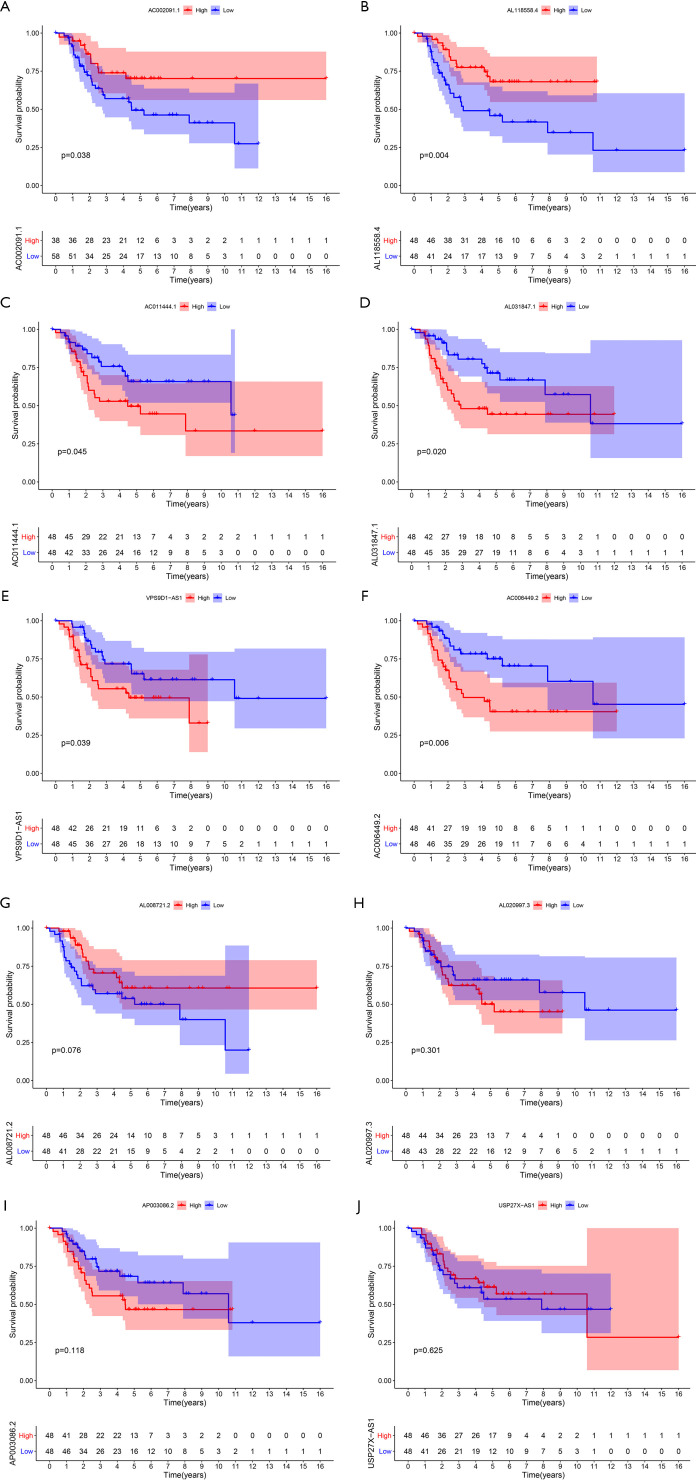
Thirty upregulated and 22 downregulated lncRNAs were identified in the localized and metastatic OSs samples. Univariate and multivariate cox regression analyses were undertaken to select 6 lncRNA pairs to establish the prognostic signature, the model was valuable in predicting OSs prognosis. Further, the expression of the finally selected irlncRNAs indicated that VPS9D1-AS1 (P=0.031), AP003086.2 (P=0.041), AL031847.1 (P=0.008), AL020997.3 (P=0.020), AC011444.1 (P=0.025), and AC006449.2 (P=0.003) were significantly upregulated in metastasis patients, but USP27X-AS1 (P=0.046), AL008721.2 (P=0.005), AC002091.1 (P=0.033), and AL118558.4 (P=0.049) were significantly overexpressed in localized patients. The overexpression of AC002091.1 (P=0.038) and AL118558.4 (P=0.004) resulted in better overall survival, but the upregulation of AC011444.1 (P=0.045), AL031847.1 (P=0.020), VPS9D1-AS1 (P=0.039), and AC006449.2 (0.006) led to a poor outcome. Differences in immune cell infiltration indicated that metastatic patients and localized have significant difference of 4 (CD4) T cells (P=0.006), monocytes (P=0.029), activated mast cells (P=0.018), and neutrophils (P=0.026), and a high abundance of activated dendritic cells (P=0.010) and activated mast cells (P=0.049) resulted in poor prognosis. Patients in the high-risk–score group were resistant to axitinib, but sensitive to dasatinib, bortezomib, and cisplatin.
Conclusions
In the present study, IRLPs were used to construct a novel and practical model for predicting the prognosis of localized and metastatic OSs in children.
Keywords: Children metastatic osteosarcoma (children metastatic OSs), immune-related lncRNA, prognosis, drug sensitivity
Introduction
Osteosarcoma (OSs) is the most common primary malignant bone sarcoma. OSs has a bimodal age distribution. Specifically, OSs has the highest incidence in children and adolescents, followed by adults aged over 60 (1). In 2014, bone tumors comprised 3–5% of childhood cancers in the United States (US) (2). OSs comes from primitive mesenchymal cells that originate from bone or soft tissue. Left untreated, OSs runs a dismal course. OSs may be localized; however, it often metastasizes to the lung. Patients with localized OS have a 5-year survival rate of about 80%; however, this rate decreases to 15–30% in patients with metastatic OSs. The potential mechanisms of tumorigenesis including radiation exposure, alkylating agent exposure, and rip bone proliferation. Several hereditary disorders related to tumor suppressor gene alteration, such as hereditary retinoblastoma and the Li-Fraumeni cancer family syndrome, may increase the risk of OSs. Before the practice of intensive chemotherapy, more than 90% of OS patients died from pulmonary metastases (3). Thus, OSs represents a major challenge for public health management worldwide.
Long non-coding ribonucleic acids (lncRNAs) are a type of RNA characterized by more than 200 nucleotides, but lncRNAs do not code proteins. LncRNAs comprise approximately 80% of human transcriptomes. LncRNAs can regulate gene expression in unusual ways, and interact with deoxyribonucleic acid (DNA), RNA, and proteins to achieve enhancement or inhibition expression. The dysregulation of lncRNAs has been observed in multiple cancer types, including OSs (4-6). Recent research has shown that lncRNAs affect the cancer process via genomic and transcriptomic changes, and affect the tumor microenvironment (TME). The underlying mechanism of lncRNAs regulate the immune microenvironment by regulating immune-related gene expression to affect immune cell infiltration into the TME.
In recent years, research has shown that the TME plays a critical role in tumorigenesis, metastasis, and resistance to therapy. In relation to OSs, many studies had shown the significance of the TME in every process of OSs (7-10). However, the role of immune-related lnRNAs (irlncRNAs) in OSs has not yet been well classified. Several studies of other types of cancer have shown that several irlncRNAs could be biomarkers for pancreatic cancer, head and neck squamous cell carcinoma, and clear cell renal cell carcinoma (11-13). Notably, Yang et al. investigated the relationship between the TME and OSs metastasis (14). We know that irlncRNAs play a significant role in immune infiltration, and that immune infiltration is significantly correlated to tumor progression, including metastasis. However, the association between irlncRNAs and metastatic OSs remains unclear. In this study, we explored the relationship between irlncRNAs and metastatic OSs by constructing a novel modeling algorithm. We then estimated the predictive value of the model among patients with metastatic OSs in relation to its diagnostic effectiveness, chemotherapeutic efficacy, and tumor immune infiltration. We present the following article in accordance with the REMARK reporting checklist (available at https://dx.doi.org/10.21037/tp-21-226).
Methods
Raw data
The RNA-sequencing data and clinical OSs data were obtained from The Therapeutically Applicable Research to Generate Effective Treatments (TARGET) database (https://ocg.cancer.gov/programs/target). Immune-related genes were collected from the Import database (https://www.immport.org/).
Screening for irlncRNA in OSs
The lncRNAs from the OSs expression matrix (TPM standardized values) were extracted, and the correlations between the immune genes and lncRNAs were analyzed. The threshold value for the correlation coefficients was set as R>0.4, and the P value was set as <0.001.
Screening for differentially expressed irLncRNAs
The differences between irlncRNAs (metastatic versus non-metastatic) were analyzed using a Wilcox test in R software (https://www.r-project.org/). The filtering standard was a log fold change |logFC| >0.5 and a P value <0.05. Heatmap and volcano plots for the differentially expressed genes were generated using the ggplot2 package in R software.
Construction of IRLPs
The differentially expressed irLncRNAs were paired one by one. In each irLncRNA pair (IRLP), if the expression of the former lncRNA was higher than that of the latter lncRNA, the expression of this IRLP was recorded as 1, and otherwise, 0.
Construction of a prognostic signature for IRLPs
Univariate and multivariate regression cox analyses were used to construct a prognostic signature for the IRLPs. The Kaplan-Meier method was used to generate the survival curve and assess the predictive power of the IRLPs signature. The maximum Yuden index (sensitivity + specificity – 1) of the 1-year receiver operating characteristic (ROC) was identified as the best cutoff value based on R packages survival ROC. All samples were divided into high- or low-risk groups based on the best cutoff value. The nomogram and calibration curves were generated using R package rms.
Tumor-infiltrating immune cell analysis.
The CIBERSORT deconvolution algorithm can characterize the cell composition of complex tissues based on RNA-sequencing profiles to estimate the relative abundance of 22 immune cells. We used the CIBERSORT algorithm to calculate the immune cell composition of 101 OSs samples, and analyzed the correlation between the risk score of the IRLP signature and immune infiltrating cells.
Analysis of the risk score and drug sensitivity
The R package pRRophetic, based on gene expression and drug sensitivity data from many cancer cell lines, and then applying those models to gene expression data from primary tumor biopsies (15). Based on the prophetic package, we analyzed the relationship between the signature and drug sensitivity risk score.
Statistical analysis
The differential immune-related lncRNAs were screened through R package limma, and the thresholds were set as |logFC| >0.5 and P<0.05; The Kaplan-Meier plot was used to perform the differential survival between different groups, log-rank P<0.05 was considered statistically significant. Univariate and multivariate (stepwise) cox regression was used to construct the prognostic signature. Wilcoxon and Spearman were used for difference analysis and correlation analysis, respectively. P<0.05 was considered statistically significant.
Ethical statement
The study was conducted in accordance with the Declaration of Helsinki (as revised in 2013).
Results
Obtaining the IRLPs
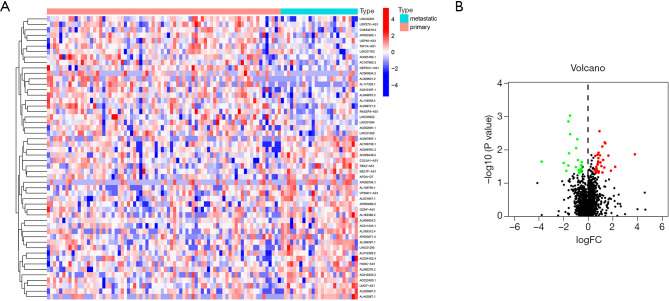
We extracted a total of 13,522 lncRNAs from the 101 OS samples in the TARGET database. After a correlation analysis with the immune genes, 1,082 irlncRNAs were obtained. Next, 52 lncRNAs differentially expressed between primary and metastatic tumor were screened to construct immune IRLPs. A heatmap plot of the differentially expressed lncRNAs was generated (see Figure 1A). A volcano plot showed a total of 30 upregulated and 22 downregulated lncRNAs (see Figure 1B). We then constructed 749 IRLPs based on the differentially expressed lncRNAs.
Figure 1.
Heatmap and volcano plot of differentially expressed irlncRNAs. Top 50 upregulated and downregulated lncRNAs; blue and red, represent low and high expression, respectively (A); volcano plot of differential lncRNAs (B).
Prognostic signature results of the IRLPs
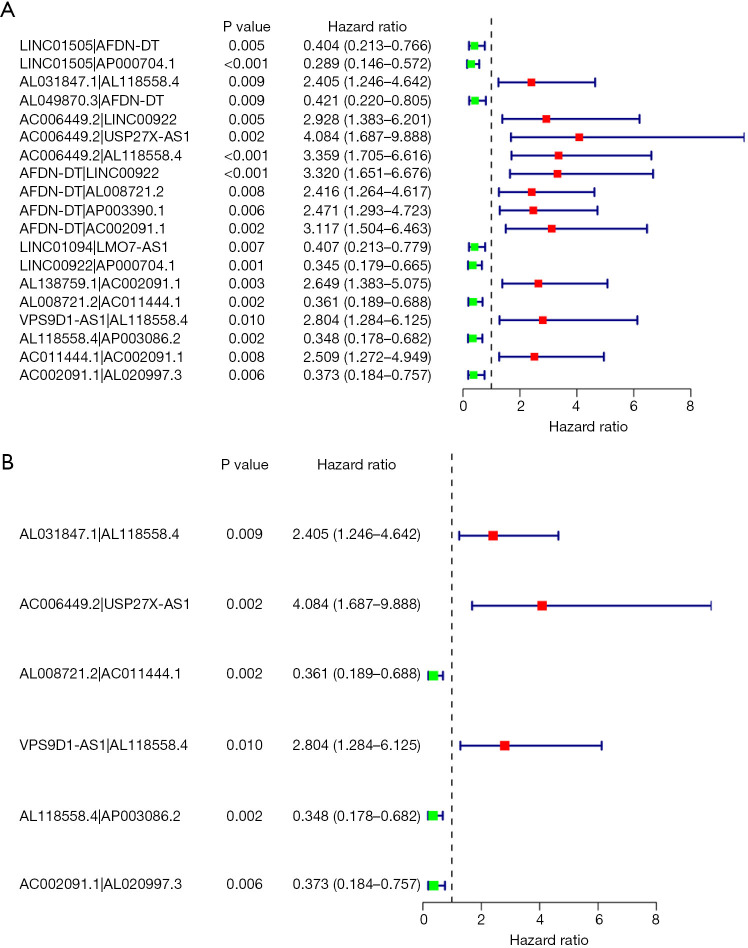
The results of the univariate Cox regression indicated that 19 IRLPs had a significant effect on the overall survival of OS patients (see Figure 2A). A multivariate cox regression analysis was conducted to identify 12 lncRNA pairs that were then used to establish the IRLP prognostic signature (see Figure 2B).
Figure 2.
Forest map of the univariate and multivariate cox regression analyses. Forest map of the univariate Cox regression analysis (A); forest map of the multivariate cox regression analysis (B); green and red represent favorable lncRNA pairs and harmful lncRNA pairs for overall survival, respectively.
The best cutoff value determination and the Kaplan-Meier survival analysis of the IRLP signature
The area under the curve (AUC) value of the 3-year ROC curve of the IRLP signature was 0.842, and the best cutoff value for the risk score was 1.315 (see Figure 3A). The AUC values for the 1-year, 3-year, and 5-year ROC curves of the signature were 0.816, 0.842, and 0.848, respectively (see Figure 3B). A Kaplan-Meier survival analysis indicated that the low-risk group had a better overall survival rate than the high-risk group (see Figure 3C).
Figure 3.
Best cutoff value determination and Kaplan-Meier survival analysis of the IRLP signature. The 3-year ROC curve and the determination of the best cutoff value (A); the 1-year, 3-year, and 5-year ROC curves (B); the X-axis and Y-axis represent the false positive and true positive rates, respectively; Kaplan-Meier survival analysis of a high- and low-risk groups for the IRLP signature (C). LPs, immune-related lncRNA pairs; IRLP, irlncRNA pair; ROC, receiver operating characteristic.
The nomogram, risk score curve, the survival status chart, and a calibration curve of the IRLP signature
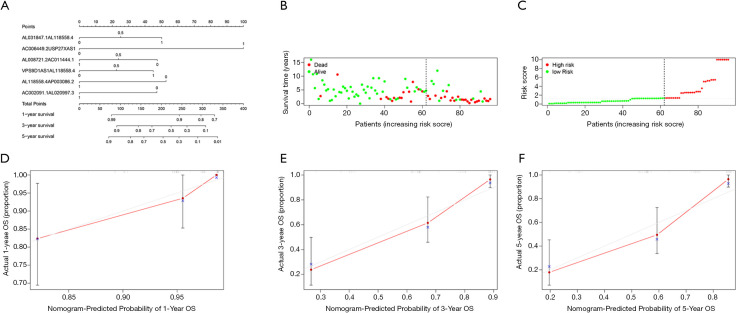
Figure 4A shows the nomogram of the IRLP signature. The risk score curve and the survival status chart show the base of the best cutoff value. Ninety-six OS patients with complete survival data were divided into the high-risk group (n=34) or the low-risk group (n=62) (see Figure 4B,C). The 1-year, 3-year, and 5-year calibration curves showed that the IRLP nomogram was highly predictive of OSs patients’ overall survival (see Figure 4D,E,F).
Figure 4.
The Nomogram, risk score curve, survival status chart, and a calibration curve of the IRLPs signature. Nomogram of the IRLP signature; the first line of the nomogram represents the score corresponding to each indicator; lines 2–7 correspond to the expression score of each of the IRLPs; line 8 represents the total score; lines 9–11 illustrate the overall survival rate of OS for the corresponding score of 1, 3, and 5 years (A). The risk score curve (B); the survival status chart (C); the 1-year (D), 3-year (E), and 5-year (F) calibration curves of the nomogram; the X-axis represents the probability predicted by the nomogram; the Y-axis represents OS patients’ actual survival proportion. LPs, immune-related lncRNA pairs; IRLP, irlncRNA pair; OS, osteosarcoma.
Prognostic analyzed signature risk score and clinical features
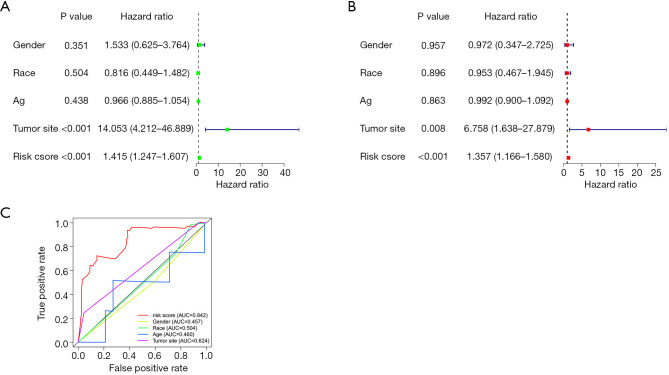
The univariate and multivariate cox regression analyses of the risk score and clinical features indicated that of the clinical features, risk score was an independent prognostic factor (P<0.001; see Figure 5A,B). The AUC value of the 3-year ROC curve showed that risk score had a better prognostic ability than tumor size, age, race, and gender in OSs patients (see Figure 5C).
Figure 5.
Prognostic analyzed signature risk score and clinical features. Forest map of univariate and multivariate Cox regression analyses of risk score and clinical features (A,B); the 3-year ROC curve of risk score and clinical features and the corresponding AUC value (C). ROC, receiver operator characteristic; AUC, area under the curve.
lncRNA differential expression between primary and metastatic patients in relation to the IRLP signature
In the IRLP prognostic signature, 6 pairs of 10 lncRNAs (i.e., AC006449.2, AC011444.1, AL020997.3, AL031847.1, AP003086.2, and VPS9D1-AS1) were highly expressed in patients with metastasis (see Figure 6A,B,C,D,E,F), while AC002091.1, AL008721.2, AL118558.4, and USP27X-AS1 were lowly expressed in patients with metastasis (see Figure 6G,H,I,J).
Figure 6.
The lncRNA differential expression between primary and metastatic patients in the IRLP signature. AC006449.2 (A), AC011444.1 (B), AL020997.3 (C), AL031847.1 (D), AP003086.2 (E), VPS9D1-AS1 (F), AC002091.1 (G), AL008721.2 (H), AL118558.4 (I), and USP27X-AS1 (J). IRLP, irlncRNA pair.
The effect of lncRNAs on expression and overall survival in the IRLP signature
The Kaplan-Meier survival analysis indicated that the high expression of AC002091.1 (P=0.038) and AL118558.4 (P=0.004) resulted in better overall survival than the lower expression among OSs patients (see Figure 7A,B); The high expression of AC011444.1 (P=0.045), AL031847.1 (P=0.020), VPS9D1-AS1 (P=0.039), and AC006449.2 (0.006) reduced OS patients’ overall survival (see Figure 7C,D,E,F). However, the high/low expression of AL008721.2, AL020997.3, AP003086.2, and USP27X-AS1 had no significant effect on OS patients’ overall survival (P>0.05; see Figure 7G,H,I,J).
Figure 7.
Kaplan-Meier survival analysis of lncRNAs in the IRLP signature. AC002091.1 (A); AL118558.4 (B); AC011444.1 (C); AL031847.1 (D); VPS9D1-AS1 (E); AC006449.2 (F); AL008721.2 (G); AL020997.3 (H), AP003086.2 (I); and USP27X-AS1 (J). IRLP, irlncRNA pair.
Tumor-infiltrating cell analysis in OSs patients
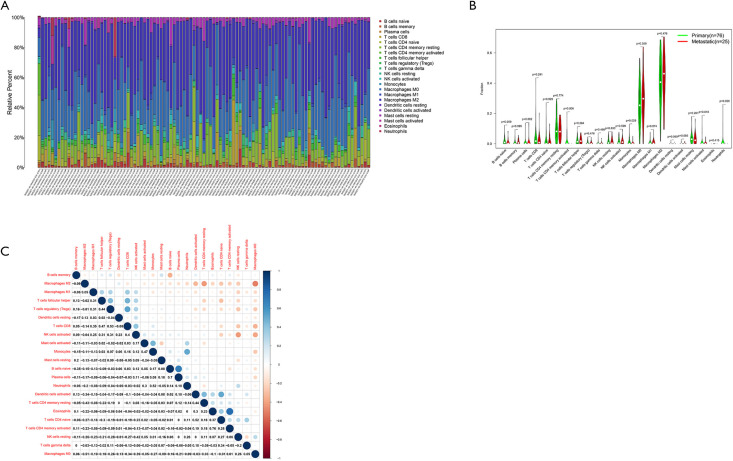
We calculated the relative abundance of 22 immune cells in 101 OS samples based on the CIBERSORT algorithm. A histogram demonstrated the abundance of 22 immune cells (see Figure 8A). A differential analysis between primary and metastatic patients indicated that activated memory cluster of differentiation 4 (CD4) T cells (P=0.006), monocytes (P=0.029), activated mast cells (P=0.018), and neutrophils (P=0.026) had low expression in metastatic OSs patients (see Figure 8B). The correlation between the 22 immune cells showed that activated mast cells were positively correlated with activated natural killer (NK) cells but negatively correlated with M2 macrophages and memory B cells (see Figure 8C).
Figure 8.
Tumor-infiltrating cell analysis of OS patients. Histogram of the abundance of 22 immune cells (A); the violin plot of the abundance of 22 immune cells in the primary and metastatic samples; the X-axis represents 22 kinds of immune cells; the Y-axis represents the relative abundance of the immune cells (B); a heatmap plot of the correlation between the 22 immune cells; blue and red represent positively and negatively correlated, respectively (C). OS, osteosarcoma.
The relationship between the abundance of immune cells and the overall survival of OSs patients
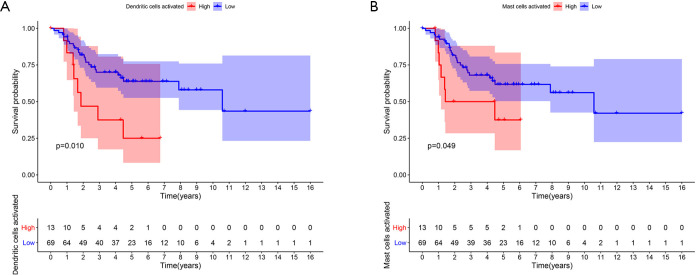
The results of the Kaplan-Meier survival analysis showed that a high abundance of activated dendritic cells (P=0.010) and activated mast cells (P=0.049) resulted in a poor prognosis (see Figure 9A,B).
Figure 9.
A Kaplan-Meier survival analysis of the expression of immune cells and prognosis in OS patients. Activated dendritic cells (A); activated mast cells (B). OS, osteosarcoma.
Analysis of the correlation between risk score and an abundance of immune cells
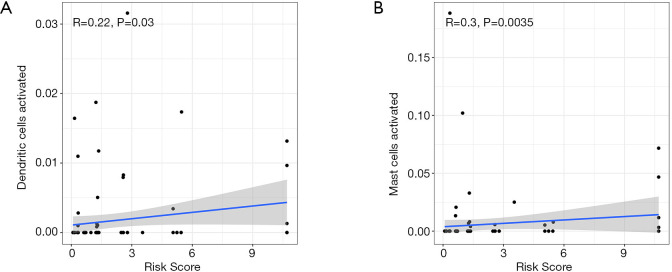
A Spearman correlation analysis showed that risk score was positively correlated with activated dendritic cells (R=0.22, P=0.03) and activated mast cells (R=0.3, P=0.0035) (see Figure 10A,B).
Figure 10.
Relationship between risk score and immune cells. Activated dendritic cells (A); activated mast cells (B).
Relationship between risk score and drug sensitivity
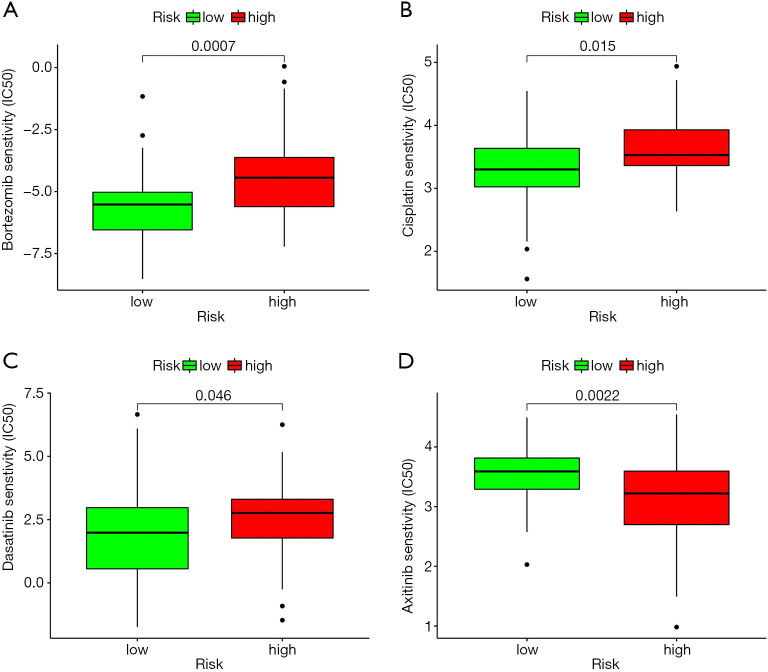
The analysis results of the drug half-maximal inhibitory concentration (IC50) and risk score showed that axitinib had a lower IC50 in the high-risk group than the low-risk group. Thus, axitinib was found to have a better therapeutic effect in high-risk OSs patients (see Figure 11).
Figure 11.
Relationship between risk score and drug sensitivity based on the R package pRRophetic. Bortezomib (A); cisplatin (B); dasatinib (C); and axitinib (D).
Discussion
Based on knowledge that coding RNA and non-coding RNA play essential roles in malignancies, studies are now using them to predict the prognosis of multiple cancer types, such as gastric cancer, hepatocellular carcinoma, and bladder cancer (16-18). Most of these studies’ signatures were analyzed by quantifying the transcriptional expression levels. Based on a number of immune-related gene pairing studies, we attempted to develop a novel and reasonable model using an IRLP that did not require the transcriptional expression levels of these irlncRNAs.
The clinical data and transcriptome of OSs were obtained from the TARGET database, and the immune-related genes were derived from the imported dataset. A correlation analysis of the immune-related genes and the lncRNAs was then undertaken. Next, the differential expressions of IRLPs were analyzed between localized OS and distant metastatic OSs, and a prognostic model was constructed based on the significant differentially expressed IRLPs. Further, we also analyzed the association between the IRLP signature risk score, and the infiltration of the immune cells. As finding a novel and effective therapeutic regimen is the ultimate goal of cancer research, we investigated the correlation between risk score and drug resistance to provide valuable strategies for conquering drug resistance.
Recently, several studies have shown that some lncRNAs are significant regulators of the TME (19,20). The TME plays a crucial role in tumor progression, including distant metastasis for multiple cancer types (21-23). The immune cell is one of the main contents of the TME. The abundance of different immune cells can be used to distinguish among outcomes for cancer patients. Gomez-Brouchet et al. showed that the higher tumor-associated macrophage infiltration resulted from less metastasis and led to a better prognosis (24). However, immune cells infiltrating the TME were regulated by some regulators, such as immune-related genes, irlncRNAs, and tumor cells. Several studies have shown that irlncRNAs play a significant role in assessments of cancer patients’ prognoses (25,26). irlncRNAs appear to regulate the TME by regulating the expression of immune-related genes.
In the present study, the univariate analysis identified 19 irlncRNAs that had a significant effect on the prognosis of OSs. A multivariate analysis was conducted to confirm the 19 irlncRNAs, and AL031847.1|AL118558.4, AC006449.2|USP27X-AS1, AL008721.2|AC011444.1, VPS9D1-AS1|AL118558.4, AL118558.4|AP003086.2, AC002091.1|AL020997.3 were selected in the final analysis. To date, only a few studies have investigated the role of AL020997.3 and VPS9D1-AS1 in cancer and other diseases. Ferguson et al. showed that AL020997.3 enhanced the interleukin 6 expressions for monocytes (27). Several studies have investigated the role of VPS9D1-AS1 in multiple cancer types, such as colorectal cancer, prostate cancer, lung adenocarcinoma, hepatocellular carcinoma, acute myeloid leukemia, acute lymphoblastic leukemia, and gastric cancer (28-34). Our results showed that metastatic patients had significantly higher lncRNA-VPS9D1-AS1 than localized patients, and the overexpression of lncRNA-VPS9D1-AS1 indicated a poor outcome. However, no study has investigated the role of lncRNA-VPS9D1-AS1 in OSs.
Tan et al. showed the higher expression of lncRNA-VPS9D1-AS1 led to a poor prognosis of non-small cell lung cancer (NSCLC) (35). Fa et al. indicated that lncRNA-VPS9D1-AS1 promoted tumor progression by enhancing hepatocellular carcinoma cell proliferation, migration, and stemness (29). Xiao et al. showed lncRNA-VPS9D1-AS1 can improve the expansion of acute lymphoblastic leukemia (33). Han et al. showed that lncRNA VPS9D1-AS1 enhanced the malignant phenotype of NSCLC by sponging microRNA-532-3p and upregulating expression of high mobility group AT-hook 2 (HMGA2) (36). Thus, LncRNA VPS9D1-AS1 appears to be a promoter of cancer progression.
We explored the role of irlncRNAs in OSs, and investigated the association between irlncRNAs and immune cell infiltration. In relation to immune cell abundance between primary and metastatic patients, we found fewer activated memory CD4 T cells (P=0.006), monocytes (P=0.029), activated mast cells (P=0.018), and neutrophils (P=0.026) in metastatic OSs patients than localized OSs patients. Derakhshani et al. showed that mast cells might play different roles in different cancer types (37). The infiltration of neutrophils into the TME of OSs may be influenced by chemokine CXCL1 and its receptor CXCR2 (38). Hanna et al. showed that non-classical patrolling monocytes could inhibit cancer metastasis to the lung (39). Undoubtedly, OSs has a preference for metastasizing to the lungs. Kelleher et al. indicated that monocytes might have a significant effect on metastatic OSs (40). We further explored the various roles of immune cells in OSs patients, and found that lower activated mast cell and dendritic cell infiltration led to a better prognosis among OS patients.
Finally, we performed a drug sensitivity analysis based on the risk score, and found that the high-risk group was resistant to axitinib. Axitinib is a small molecule inhibitor receptor tyrosine kinases VEGFR1-3. Axitinib has been widely used to treat kidney cancer (41-43). In relation to OSs, Kaya et al. revealed that the upregulation of the vascular endothelial growth factor (VGFR) led to a poor outcome for OSs patients, while a positive VGFR increased lung metastasis (44). Geller et al. showed that axitinib could be used to treat recurrent or refractory OSs patients (45). However, the high-risk group were sensitive to dasatinib. Beck et al. showed that a combination of ceritinib and dasatinib could be used to treat advanced OSs patients (46). Bortezomib is commonly used to treat multiple myeloma. Our drug sensitivity analysis showed that the high-risk group was sensitive to it. Lou et al. revealed that bortezomib could promote OSs cell apoptosis and autophagy via the mitogen-activated protein kinase pathway (47). Further, several studies have been shown that bortezomib can induce OSs cell death via different pathways (48-50). Thus, these novel regimens should be a choice for OSs patients.
Conclusions
In the present study, IRLPs were used to construct a novel and practical model for predicting the prognosis of children with localized and metastatic OSs; the model was not based on the transcriptional expression levels. The drug sensitivity analysis provides more effective therapy regimens based on risk score.
Supplementary
The article’s supplementary files as
Acknowledgments
Funding: None.
Ethical Statement: The authors are accountable for all aspects of the work in ensuring that questions related to the accuracy or integrity of any part of the work are appropriately investigated and resolved. The study was conducted in accordance with the Declaration of Helsinki (as revised in 2013).
Reporting Checklist: The authors have completed the REMARK reporting checklist. Available at https://dx.doi.org/10.21037/tp-21-226
Conflicts of Interest: All authors have completed the ICMJE uniform disclosure form (available at https://dx.doi.org/10.21037/tp-21-226). The authors have no conflicts of interest to declare.
(English Language Editor: L. Huleatt)
References
- 1.Corre I, Verrecchia F, Crenn V, et al. The Osteosarcoma Microenvironment: A Complex But Targetable Ecosystem. Cells 2020;9:976. 10.3390/cells9040976 [DOI] [PMC free article] [PubMed] [Google Scholar]
- 2.Xie X, Zeng Z, Tu J, et al. Regional lymph node involvement is associated with poorer survivorship in patients with upper extremity osteosarcoma than with lower extremity osteosarcoma: a SEER analysis. Transl Cancer Res 2020;9:7022-33. 10.21037/tcr-20-2187 [DOI] [PMC free article] [PubMed] [Google Scholar]
- 3.Mentzel T, Fletcher JA. Pathology and genetics of tumours of soft tissue and bone. Low Grade Myofibroblastic Sarcoma 2002:94-5. [Google Scholar]
- 4.Fu D, Lu C, Qu X, et al. LncRNA TTN-AS1 regulates osteosarcoma cell apoptosis and drug resistance via the miR-134-5p/MBTD1 axis. Aging (Albany NY) 2019;11:8374-85. 10.18632/aging.102325 [DOI] [PMC free article] [PubMed] [Google Scholar]
- 5.Cui T, Guo J, Jin C. Identification of a 7-mRNA signature as a prognostic biomarker in pediatric osteosarcoma. Transl Cancer Res 2020;9:6733-42. 10.21037/tcr-20-2407 [DOI] [PMC free article] [PubMed] [Google Scholar]
- 6.Zheng S, Jiang F, Ge D, et al. LncRNA SNHG3/miRNA-151a-3p/RAB22A axis regulates invasion and migration of osteosarcoma. Biomed Pharmacother 2019;112:108695. 10.1016/j.biopha.2019.108695 [DOI] [PubMed] [Google Scholar]
- 7.Raimondi L, De Luca A, Gallo A, et al. Osteosarcoma cell-derived exosomes affect tumor microenvironment by specific packaging of microRNAs. Carcinogenesis 2020;41:666-77. 10.1093/carcin/bgz130 [DOI] [PubMed] [Google Scholar]
- 8.Wang S, Ma F, Feng Y, et al. Role of exosomal miR21 in the tumor microenvironment and osteosarcoma tumorigenesis and progression (Review). Int J Oncol 2020;56:1055-63. [DOI] [PubMed] [Google Scholar]
- 9.Yang C, Tian Y, Zhao F, et al. Bone Microenvironment and Osteosarcoma Metastasis. Int J Mol Sci 2020;21:6985. 10.3390/ijms21196985 [DOI] [PMC free article] [PubMed] [Google Scholar]
- 10.Zhang C, Zheng JH, Lin ZH, et al. Profiles of immune cell infiltration and immune-related genes in the tumor microenvironment of osteosarcoma. Aging (Albany NY) 2020;12:3486-501. 10.18632/aging.102824 [DOI] [PMC free article] [PubMed] [Google Scholar]
- 11.Meng L, Ding P, Liu S, et al. The emerging prospects of circular RNA in tumor immunity. Ann Transl Med 2020;8:1091. 10.21037/atm-19-4751 [DOI] [PMC free article] [PubMed] [Google Scholar]
- 12.Jiang Y, Gou X, Wei Z, et al. Bioinformatics profiling integrating a three immune-related long non-coding RNA signature as a prognostic model for clear cell renal cell carcinoma. Cancer Cell Int 2020;20:166. 10.1186/s12935-020-01242-7 [DOI] [PMC free article] [PubMed] [Google Scholar]
- 13.Wu S, Dai X, Xie D. Identification and Validation of an Immune-Related RNA Signature to Predict Survival of Patients With Head and Neck Squamous Cell Carcinoma. Front Genet 2019;10:1252. 10.3389/fgene.2019.01252 [DOI] [PMC free article] [PubMed] [Google Scholar]
- 14.Yang B, Su Z, Chen G, et al. Identification of prognostic biomarkers associated with metastasis and immune infiltration in osteosarcoma. Oncol Lett 2021;21:180. 10.3892/ol.2021.12441 [DOI] [PMC free article] [PubMed] [Google Scholar]
- 15.Geeleher P, Cox N, Huang RS. pRRophetic: an R package for prediction of clinical chemotherapeutic response from tumor gene expression levels. PLoS One 2014;9:e107468. 10.1371/journal.pone.0107468 [DOI] [PMC free article] [PubMed] [Google Scholar]
- 16.Li C, Zhang W, Yang H, et al. Integrative analysis of dysregulated lncRNA-associated ceRNA network reveals potential lncRNA biomarkers for human hepatocellular carcinoma. PeerJ 2020;8:e8758. 10.7717/peerj.8758 [DOI] [PMC free article] [PubMed] [Google Scholar]
- 17.Lyu L, Xiang W, Zhu JY, et al. Integrative analysis of the lncRNA-associated ceRNA network reveals lncRNAs as potential prognostic biomarkers in human muscle-invasive bladder cancer. Cancer Manag Res 2019;11:6061-77. 10.2147/CMAR.S207336 [DOI] [PMC free article] [PubMed] [Google Scholar]
- 18.Zhu X, Tian X, Yu C, et al. A long non-coding RNA signature to improve prognosis prediction of gastric cancer. Mol Cancer 2016;15:60. 10.1186/s12943-016-0544-0 [DOI] [PMC free article] [PubMed] [Google Scholar]
- 19.Ding L, Ren J, Zhang D, et al. A novel stromal lncRNA signature reprograms fibroblasts to promote the growth of oral squamous cell carcinoma via LncRNA-CAF/interleukin-33. Carcinogenesis 2018;39:397-406. 10.1093/carcin/bgy006 [DOI] [PubMed] [Google Scholar]
- 20.Luo Y, Yang J, Yu J, et al. Long Non-coding RNAs: Emerging Roles in the Immunosuppressive Tumor Microenvironment. Front Oncol 2020;10:48. 10.3389/fonc.2020.00048 [DOI] [PMC free article] [PubMed] [Google Scholar]
- 21.Hinshaw DC, Shevde LA. The Tumor Microenvironment Innately Modulates Cancer Progression. Cancer Res 2019;79:4557-66. 10.1158/0008-5472.CAN-18-3962 [DOI] [PMC free article] [PubMed] [Google Scholar]
- 22.Lee SS, Cheah YK. The Interplay between MicroRNAs and Cellular Components of Tumour Microenvironment (TME) on Non-Small-Cell Lung Cancer (NSCLC) Progression. J Immunol Res 2019;2019:3046379. 10.1155/2019/3046379 [DOI] [PMC free article] [PubMed] [Google Scholar]
- 23.Quail DF, Joyce JA. Microenvironmental regulation of tumor progression and metastasis. Nat Med 2013;19:1423-37. 10.1038/nm.3394 [DOI] [PMC free article] [PubMed] [Google Scholar]
- 24.Gomez-Brouchet A, Illac C, Gilhodes J, et al. CD163-positive tumor-associated macrophages and CD8-positive cytotoxic lymphocytes are powerful diagnostic markers for the therapeutic stratification of osteosarcoma patients: An immunohistochemical analysis of the biopsies fromthe French OS2006 phase 3 trial. Oncoimmunology 2017;6:e1331193. 10.1080/2162402X.2017.1331193 [DOI] [PMC free article] [PubMed] [Google Scholar]
- 25.Li Y, Jiang T, Zhou W, et al. Pan-cancer characterization of immune-related lncRNAs identifies potential oncogenic biomarkers. Nat Commun 2020;11:1000. 10.1038/s41467-020-14802-2 [DOI] [PMC free article] [PubMed] [Google Scholar]
- 26.Shen Y, Peng X, Shen C. Identification and validation of immune-related lncRNA prognostic signature for breast cancer. Genomics 2020;112:2640-6. 10.1016/j.ygeno.2020.02.015 [DOI] [PubMed] [Google Scholar]
- 27.Ferguson JF, Xue C, Gao Y, et al. Tissue-Specific Differential Expression of Novel Genes and Long Intergenic Noncoding RNAs in Humans With Extreme Response to Evoked Endotoxemia. Circ Genom Precis Med 2018;11:e001907. 10.1161/CIRCGEN.117.001907 [DOI] [PMC free article] [PubMed] [Google Scholar]
- 28.Chen M, Wu X, Ma W, et al. Decreased expression of lncRNA VPS9D1-AS1 in gastric cancer and its clinical significance. Cancer Biomark 2017;21:23-8. 10.3233/CBM-170172 [DOI] [PubMed] [Google Scholar]
- 29.Fa X, Song P, Fu Y, et al. Long non-coding RNA VPS9D1-AS1 facilitates cell proliferation, migration and stemness in hepatocellular carcinoma. Cancer Cell Int 2021;21:131. 10.1186/s12935-020-01741-7 [DOI] [PMC free article] [PubMed] [Google Scholar]
- 30.Lin L, Que Y, Lu P, et al. Chidamide Inhibits Acute Myeloid Leukemia Cell Proliferation by lncRNA VPS9D1-AS1 Downregulation via MEK/ERK Signaling Pathway. Front Pharmacol 2020;11:569651. 10.3389/fphar.2020.569651 [DOI] [PMC free article] [PubMed] [Google Scholar]
- 31.Wang X, Chen Q, Wang X, et al. ZEB1 activated-VPS9D1-AS1 promotes the tumorigenesis and progression of prostate cancer by sponging miR-4739 to upregulate MEF2D. Biomed Pharmacother 2020;122:109557. 10.1016/j.biopha.2019.109557 [DOI] [PubMed] [Google Scholar]
- 32.Wang X, Su R, Guo Q, et al. Competing endogenous RNA (ceRNA) hypothetic model based on comprehensive analysis of long non-coding RNA expression in lung adenocarcinoma. PeerJ 2019;7:e8024. 10.7717/peerj.8024 [DOI] [PMC free article] [PubMed] [Google Scholar]
- 33.Xiao S, Xu N, Ding Q, et al. LncRNA VPS9D1-AS1 promotes cell proliferation in acute lymphoblastic leukemia through modulating GPX1 expression by miR-491-5p and miR-214-3p evasion. Biosci Rep 2020;40:BSR20193461. 10.1042/BSR20193461 [DOI] [PMC free article] [PubMed] [Google Scholar]
- 34.Yang L, Xu L, Wang Q, et al. Dysregulation of long non-coding RNA profiles in human colorectal cancer and its association with overall survival. Oncol Lett 2016;12:4068-74. 10.3892/ol.2016.5138 [DOI] [PMC free article] [PubMed] [Google Scholar]
- 35.Tan J, Yang L. Long noncoding RNA VPS9D1-AS1 overexpression predicts a poor prognosis in non-small cell lung cancer. Biomed Pharmacother 2018;106:1600-6. 10.1016/j.biopha.2018.07.113 [DOI] [PubMed] [Google Scholar]
- 36.Han X, Huang T, Han J. Long noncoding RNA VPS9D1-AS1 augments the malignant phenotype of non-small cell lung cancer by sponging microRNA-532-3p and thereby enhancing HMGA2 expression. Aging (Albany NY) 2020;12:370-86. 10.18632/aging.102628 [DOI] [PMC free article] [PubMed] [Google Scholar] [Retracted]
- 37.Derakhshani A, Vahidian F, Alihasanzadeh M, et al. Mast cells: A double-edged sword in cancer. Immunol Lett 2019;209:28-35. 10.1016/j.imlet.2019.03.011 [DOI] [PubMed] [Google Scholar]
- 38.Yuan M, Zhu H, Xu J, et al. Tumor-Derived CXCL1 Promotes Lung Cancer Growth via Recruitment of Tumor-Associated Neutrophils. J Immunol Res 2016;2016:6530410. 10.1155/2016/6530410 [DOI] [PMC free article] [PubMed] [Google Scholar]
- 39.Hanna RN, Cekic C, Sag D, et al. Patrolling monocytes control tumor metastasis to the lung. Science 2015;350:985-90. 10.1126/science.aac9407 [DOI] [PMC free article] [PubMed] [Google Scholar]
- 40.Kelleher FC, O’Sullivan H. Monocytes, Macrophages, and Osteoclasts in Osteosarcoma. J Adolesc Young Adult Oncol 2017;6:396-405. 10.1089/jayao.2016.0078 [DOI] [PubMed] [Google Scholar]
- 41.Atkins MB, Plimack ER, Puzanov I, et al. Axitinib in combination with pembrolizumab in patients with advanced renal cell cancer: a non-randomised, open-label, dose-finding, and dose-expansion phase 1b trial. Lancet Oncol 2018;19:405-15. 10.1016/S1470-2045(18)30081-0 [DOI] [PMC free article] [PubMed] [Google Scholar]
- 42.Powles T, Plimack ER, Soulieres D, et al. Pembrolizumab plus axitinib versus sunitinib monotherapy as first-line treatment of advanced renal cell carcinoma (KEYNOTE-426): extended follow-up from a randomised, open-label, phase 3 trial. Lancet Oncol 2020;21:1563-73. 10.1016/S1470-2045(20)30436-8 [DOI] [PubMed] [Google Scholar]
- 43.Rini BI, Plimack ER, Stus V, et al. Pembrolizumab plus Axitinib versus Sunitinib for Advanced Renal-Cell Carcinoma. N Engl J Med 2019;380:1116-27. 10.1056/NEJMoa1816714 [DOI] [PubMed] [Google Scholar]
- 44.Kaya M, Wada T, Akatsuka T, et al. Vascular endothelial growth factor expression in untreated osteosarcoma is predictive of pulmonary metastasis and poor prognosis. Clin Cancer Res 2000;6:572-7. [PubMed] [Google Scholar]
- 45.Geller JI, Fox E, Turpin BK, et al. A study of axitinib, a VEGF receptor tyrosine kinase inhibitor, in children and adolescents with recurrent or refractory solid tumors: A Children’s Oncology Group phase 1 and pilot consortium trial (ADVL1315). Cancer 2018;124:4548-55. 10.1002/cncr.31725 [DOI] [PMC free article] [PubMed] [Google Scholar]
- 46.Beck O, Paret C, Russo A, et al. Safety and Activity of the Combination of Ceritinib and Dasatinib in Osteosarcoma. Cancers (Basel) 2020;12:793. 10.3390/cancers12040793 [DOI] [PMC free article] [PubMed] [Google Scholar]
- 47.Lou Z, Ren T, Peng X, et al. Bortezomib induces apoptosis and autophagy in osteosarcoma cells through mitogen-activated protein kinase pathway in vitro. J Int Med Res 2013;41:1505-19. 10.1177/0300060513490618 [DOI] [PubMed] [Google Scholar]
- 48.Machihara K, Namba T. Kuanoniamine C stimulates bortezomib-induced cell death via suppression of glucose-regulated protein 78 in osteosarcoma. Biochem Biophys Res Commun 2020;527:289-96. 10.1016/j.bbrc.2020.04.109 [DOI] [PubMed] [Google Scholar]
- 49.Shapovalov Y, Benavidez D, Zuch D, et al. Proteasome inhibition with bortezomib suppresses growth and induces apoptosis in osteosarcoma. Int J Cancer 2010;127:67-76. 10.1002/ijc.25024 [DOI] [PubMed] [Google Scholar]
- 50.Xian M, Cao H, Cao J, et al. Bortezomib sensitizes human osteosarcoma cells to adriamycin-induced apoptosis through ROS-dependent activation of p-eIF2alpha/ATF4/CHOP axis. Int J Cancer 2017;141:1029-41. 10.1002/ijc.30792 [DOI] [PubMed] [Google Scholar]
Associated Data
This section collects any data citations, data availability statements, or supplementary materials included in this article.
Supplementary Materials
The article’s supplementary files as


