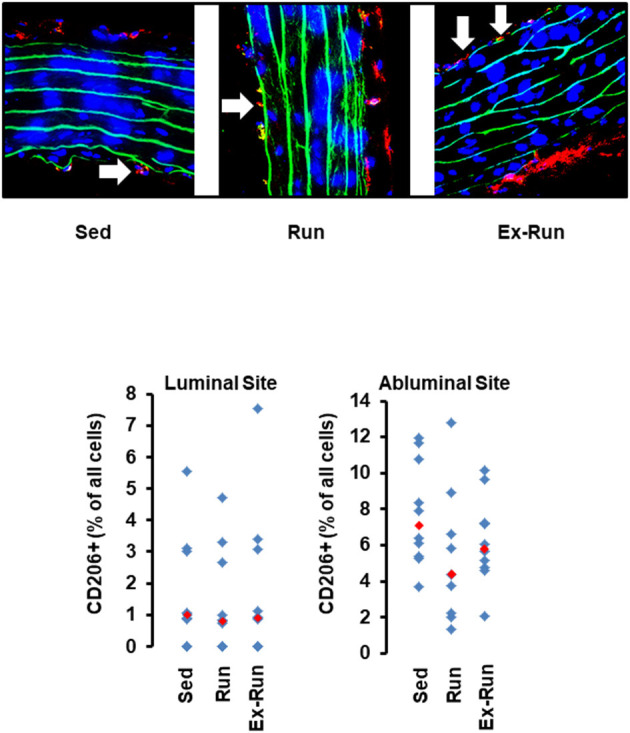
Figure 5.

Histological cross sections from aortae of hypertensive rats and the effect of voluntary running wheel activity. Top: Representative slights from confocal laser microscopy used to count the number of CD206+ cells (in red) normalized to the total cell number as calculated by DAPI-stained nuclei in blue. Lamina elastica is seen in green. Bottom: Quantification of different slices from n = 5 rats each group. Red rectangles indicate the median, blue rectangles individual data points.
