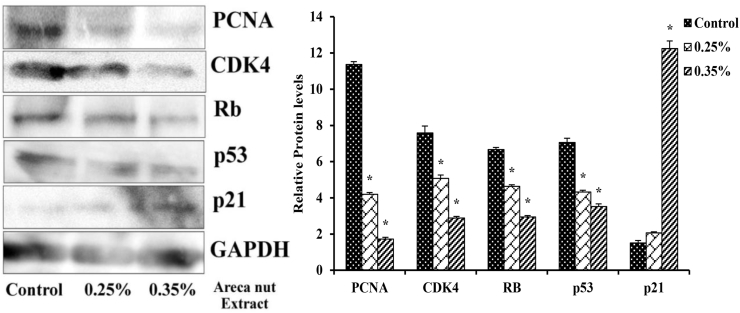
Fig. 2c.
Shows the implications of ANE on protein levels of cell cycle regulators in KB cells (Western Blotting): Data shown are mean ± SD (n = 3) and differences in protein levels of cell cycle regulators are statistically significant: if *P < 0.05 compared with control using one-way ANOVA followed by post hoc Tukey test. The bar graph represents their respective densitometric analysis.

