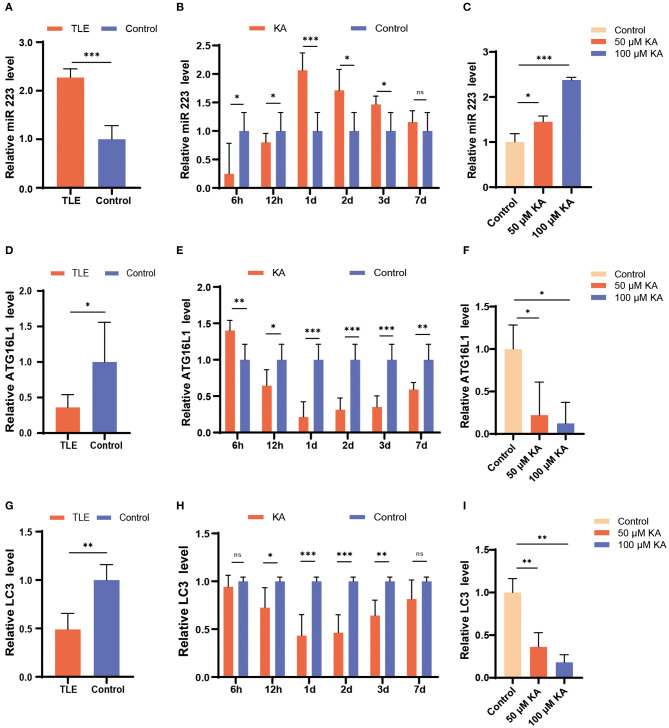
Figure 1.
Changes in miR 223, ATG16L1, and LC3 expression patterns in TLE patients, the mouse TLE model, and BV2 cells. (A) Specimens from patients with TLE (n = 10) and controls (n = 5) were analyzed for miR 223 levels. (B) C57BL/6J mice were intracerebroventricularly injected with KA or saline and sacrificed at 6 h, 12 h, 1 d, 2 d, 3 d, or 7 d after the treatment. The mice hippocampal tissues were analyzed to assess the miR 223 levels using qRT-PCR (n = 6 per group). (C) A BV2 cell line was treated with various concentrations of KA for 24 h. The miR 223 levels in the cells were analyzed using qRT-PCR (n = 3 per group). (D–F) qRT-PCR measurement of ATG16L1 mRNA levels in samples of TLE patients (D), mouse hippocampal tissue (E), and BV2 cells stimulated with KA (F). (G–I) qRT-PCR measurement of LC3 mRNA levels in samples of TLE patients (G), mouse hippocampal tissue (H), and BV2 cells stimulated with KA (I). Statistically significant differences were determined using the unpaired t-test. Data are presented as means ± SD; *p < 0.05; **p < 0.01; ***p < 0.001; ns, not significant. miR, microRNA; TLE, temporal lobe epilepsy; qRT-PCR, quantitative real-time polymerase chain reaction; SD, standard deviation; KA, kainic acid; ns, not significant; LC3, light chain 3.

