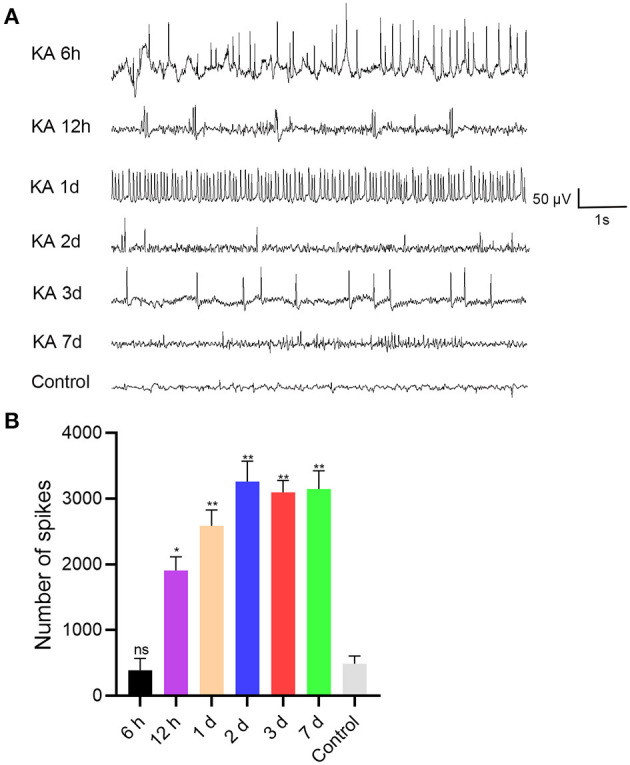
Figure 2.

EEG was recorded after intracranial injection of KA or saline in C57BL/6J mice (n = 6 per group). (A) EEG analysis was performed on the mice, and representative images were displayed. (B) The number of seizure spikes in EEG. Statistically significant differences were determined using the unpaired t-test. Data are presented as means ± SD; *p < 0.05; **p < 0.01; ns, not significant. EEG, electroencephalography; KA, kainic acid; ns, not significant.
