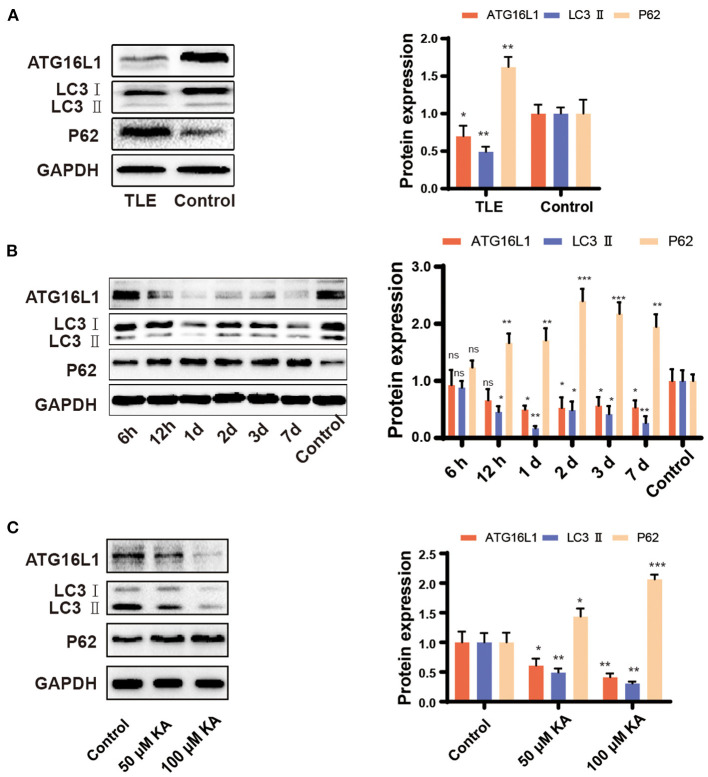
Figure 3.
Expression pattern of ATG16L1, LC3, and P62 in TLE patients, the mouse TLE model, and BV2 cells. (A) Temporal lobe tissues obtained from patients with TLE and controls, (B) mouse hippocampal tissues, and (C) BV2 cell lines were analyzed to assess the ATG16L1, LC3, and P62 protein expression levels through western blotting. Statistically significant differences were determined using the unpaired t-test. Data are presented as means ± SD. *p < 0.05; **p < 0.01; ***p < 0.001; ns, not significant (n = 3 per group). miR, microRNA; TLE, temporal lobe epilepsy; SD, standard deviation; KA, kainic acid; ns, not significant; LC3, light chain 3.

