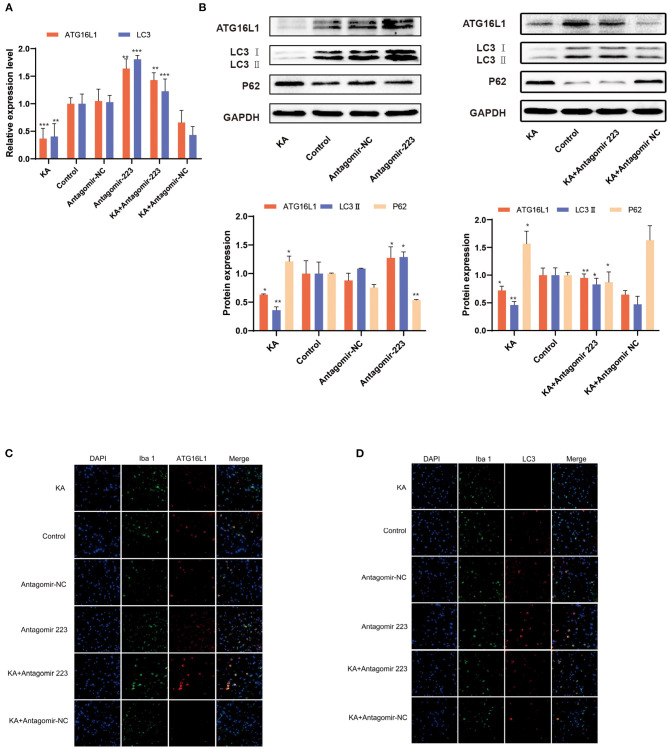
Figure 6.
Effects of miR 223 silencing on ATG16L1 expression and microglial autophagy. (A) The hippocampal tissues were analyzed for ATG16L1 and LC3 levels using qRT-PCR (n = 6 per group). (B) The hippocampal tissues were analyzed to assess the ATG16L1, LC3, and P62 protein expression levels through western blotting. (C,D) ATG16L1 levels (C) and autophagy (D) were measured in the mice hippocampus. The cell-type specificity of ATG16L1 and LC3 (TxRed, red) was established by double-fluorescent immunolabeling with the microglia-specific marker Iba 1 (FITC, green). The nuclei were stained with DAPI (blue). Statistically significant differences were determined using the unpaired t-test. Data are presented as means ± SD; *p < 0.05; **p < 0.01; ***p < 0.001. Scale bar = 10 μm. miR, microRNA; TLE, temporal lobe epilepsy; SD, standard deviation; LC3, light chain 3.

