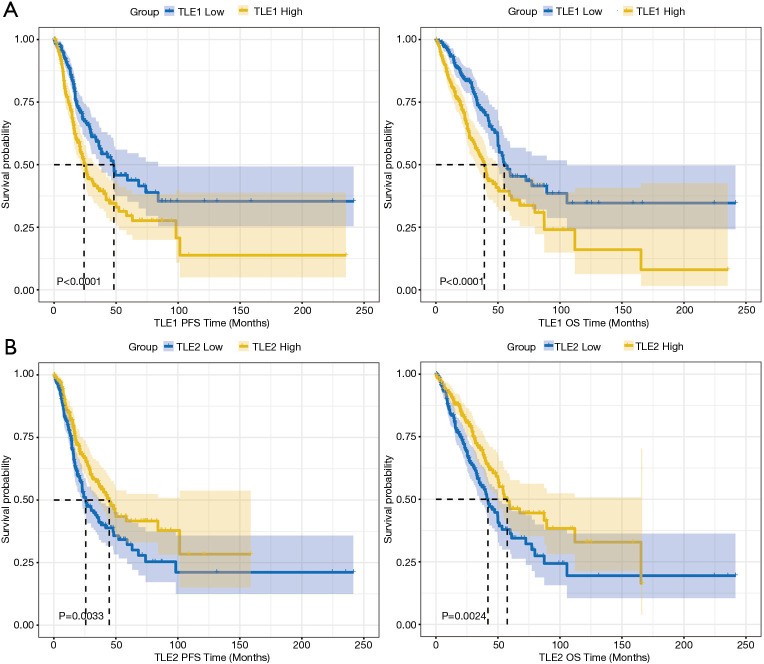
Figure 2.
The Kaplan-Meier curves of PFS and OS in the TCGA cohort. (A) Patients with high TLE1 expression had shorter PFS and OS than those with low TLE1 expression; (B) patients with high TLE2 expression had longer PFS and OS than those with low expression. PFS, progression-free survival; OS, overall survival; TCGA, The Cancer Genome Atlas; TLE, Transducin-like Enhancer of split.

