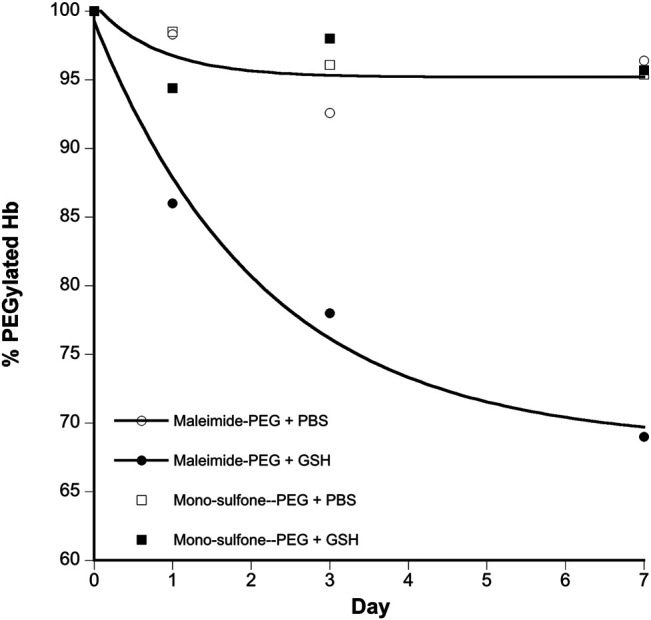
FIGURE 6.

Kinetics of stability of A12 Hb-PEG conjugates. Graphs show the % drop in Hb PEGylation (assuming 100% PEGylation at t = 0). Curve fits illustrated are mono exponential decay for the maleimide-PEG species. The mono-sulfone-PEG curve fits superimpose on the maleimide-PEG + PBS fit so have been removed for clarity. Legend: + PBS maleimide-PEG (o); + PBS mono-sulfone-PEG (□); + 1 mM GSH maleimide-PEG (●), + 1 mM GSH mono-sulfone PEG (■).
