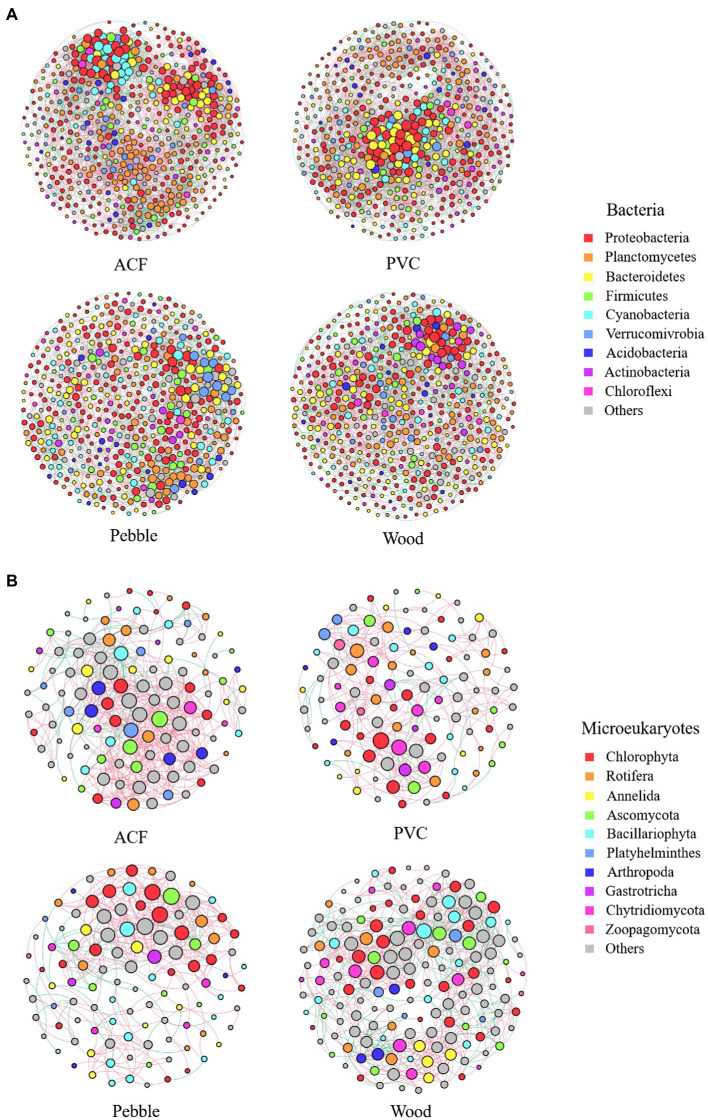
Figure 3.
Networks of bacteria (A) and microeukaryotes (B) at phylum level for the biofilm samples colonised on artificial (ACF and PVC) and natural (pebble and wood) substrates. Each point represents an independent bacterial or microeukaryotic operational taxonomic unit (OTU), node size is proportional to the relative abundance, red edges represent positive relationships, and green edges represent negative relationships among the OTUs in the network.

