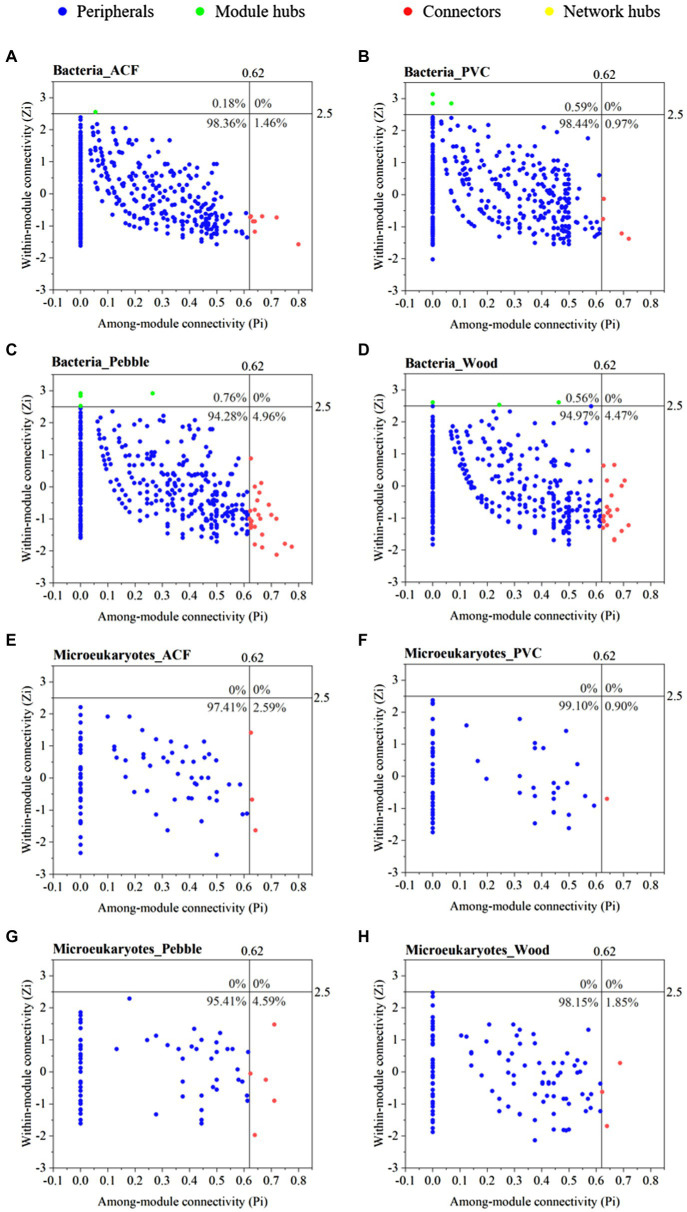
Figure 4.
Zi-Pi plot of bacteria (A–D) and microeukaryotes (E–H) at OTU level for the biofilm samples colonised on artificial (ACF and PVC) and natural (pebble and wood) substrates. The topological role of each OTU was determined according to the scatter plot of within-module connectivity (Zi) and among-module connectivity (Pi). Connectors, network hubs, and module hubs were selected as keystone species, and the annotation information of keystone species was shown in Supplementary Table S12.

