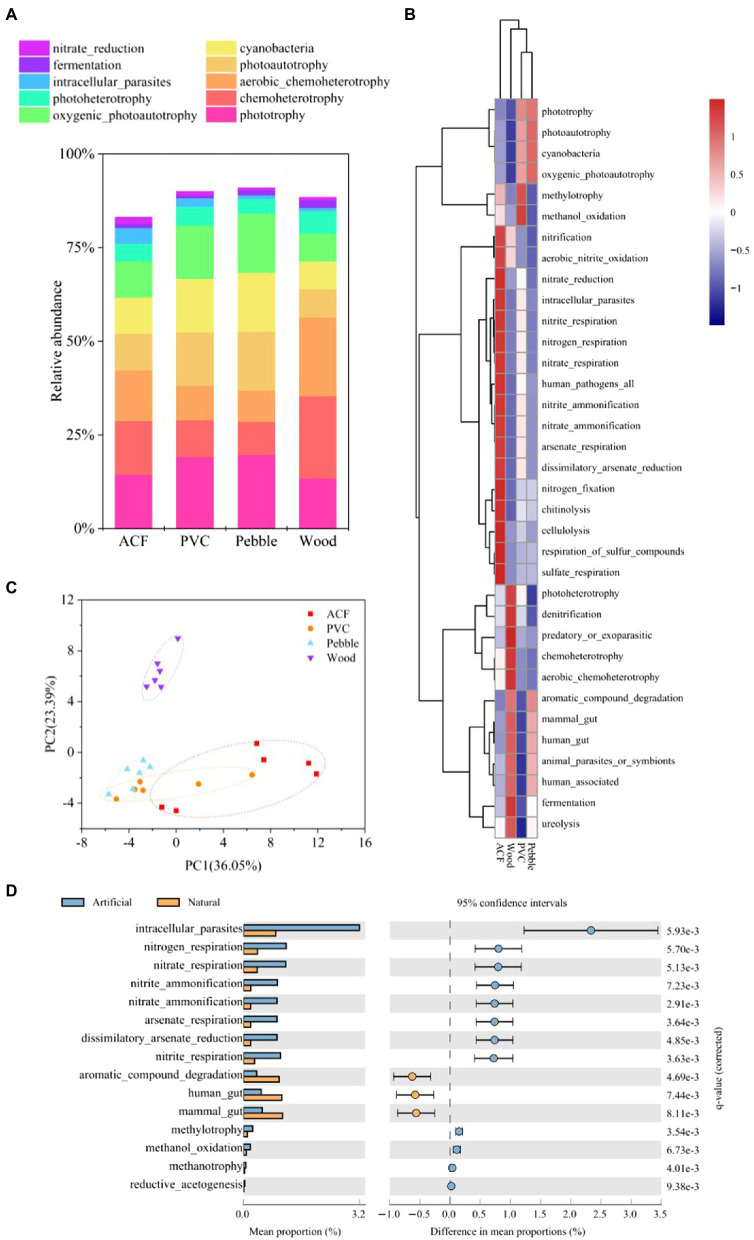
Figure 5.
(A) Relative abundance of the top 10 most abundant metabolic function pathways in bacterial biofilms from artificial (ACF and PVC) and natural (pebble and wood) substrates. Statistical comparison between the substrate types was performed using one-way ANOVA followed by Tukey’s post-hoc tests, and results FIGURE 5 | are provided in Supplementary Table S13. (B) Heatmap-mean analysis of bacterial biofilms at the function level (n = 6). (C) Principal component analysis (PCA) plot depicts bacterial biofilms on artificial (ACF and PVC) and natural (pebble and wood) substrates based on the Bray-Curtis distance. Statistical comparison was deduced by PERMANOVA, and results are provided in Supplementary Table S14. (D) Comparison of the bacterial metabolic function pathways’ abundance between artificial (ACF and PVC) and natural (pebble and wood) substrates using Statistical Analysis of Metagenomic Profiles (STAMP). See also Supplementary Table S15.

