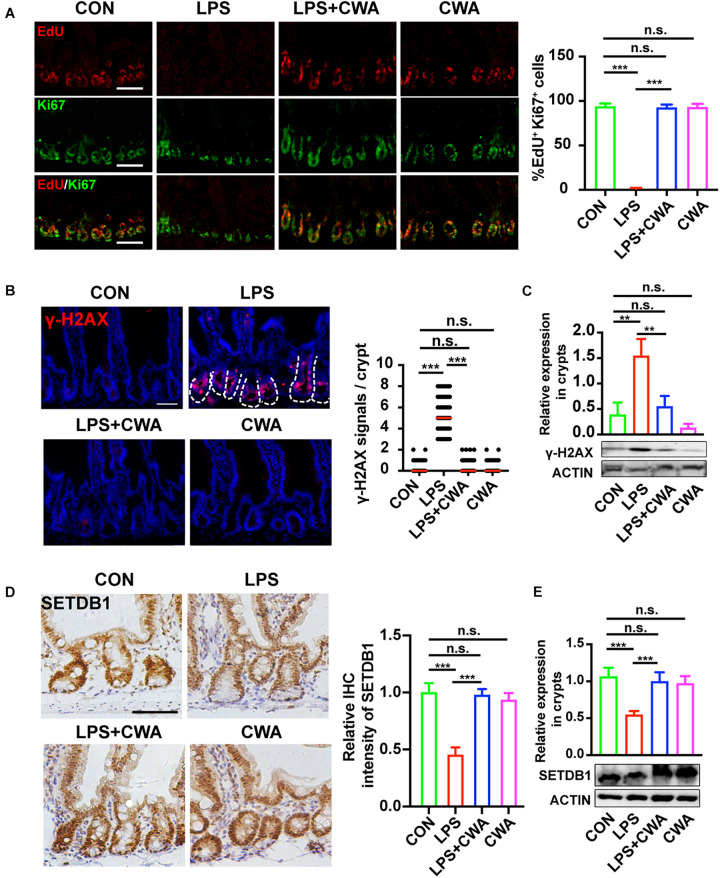
FIGURE 5.
CWA suppresses the genome instability. (A) Representative image of co-stained EdU and Ki67 in SI crypts. EdU was allowed to incorporate for 4 h before harvest. The graph in the right is the statistical analysis of overlapped EdU and Ki67 cells. (B) Representative immunofluorescence images of γ-H2AX expression in crypt at 24 h after CWA administration and numbers of γH2AX + cells in crypts. (C) Western blot analysis of γ-H2AX expression in crypts. (D) Representative IHC image of SETDB1 expression at 24 h after CWA administration and analysis of SETDB1 IHC intensity. (E) Western blot analysis of SETDB1 expression in crypts. Scale bars, 100 μm. ***P < 0.001, **p < 0.01 by two-sided, unpaired t-test. All data represent at least three independent experiments.

