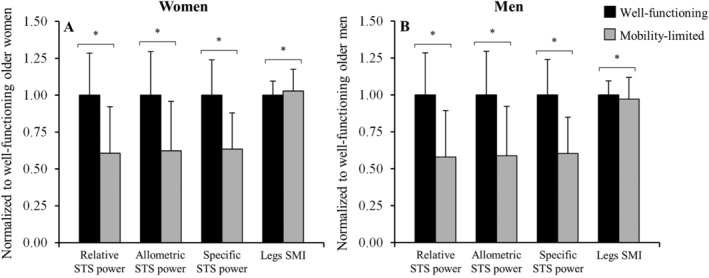
Figure 1.

Comparison between older subjects with (grey bars) and without (black bars) mobility limitations regarding sit‐to‐stand (STS) power measures and legs skeletal muscle index (SMI), separately in women (A) and men (B), and adjusted for study cohort. Data are normalized to sex‐specific values found in the well‐functioning groups. *Significant differences noted between older subjects with and without mobility limitations (P < 0.05).
