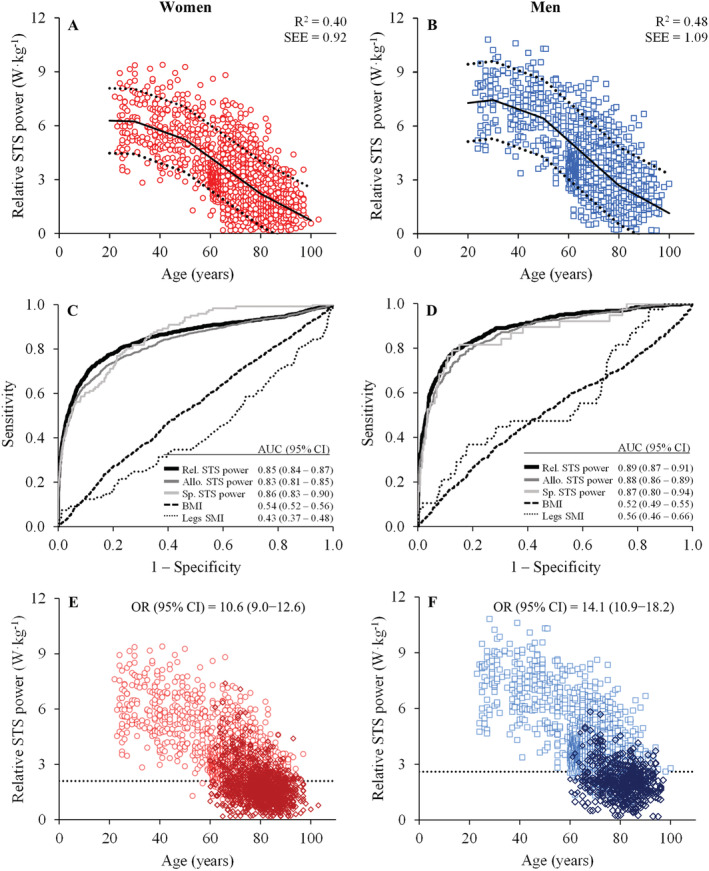
Figure 2.

Trajectories of relative sit‐to‐stand (STS) muscle power throughout the lifespan in women (A; red open circles; n = 6479) and men (B; blue open squares; n = 3427) [regression lines (continuous), 95% prediction intervals (dashed), coefficient of determination (R 2), and standard error of the estimate (SEE) obtained by segmented regression analysis]; and receiver operator characteristic curve plot for women (C) and for men (D). Area under the curve (AUC) with 95% confidence intervals (CI) indicate the ability of the different measures to discriminate between well‐functioning and mobility‐limited older subjects. Finally, the participants above and below the cut‐off points for low relative muscle power (dashed lines) are shown in (E) for women (red open circles; cut‐off point = 2.1 W·kg−1) and in (F) for men (blue open squares; cut‐off point = 2.6 W·kg−1). Subjects exhibiting mobility limitations (open diamonds) are differentiated from those without mobility limitations. Allo., allometric; BMI, body mass index; CI, confidence interval; OR, odds ratio; Rel., relative; SMI, skeletal muscle index; Sp., specific; STS, sit‐to‐stand.
