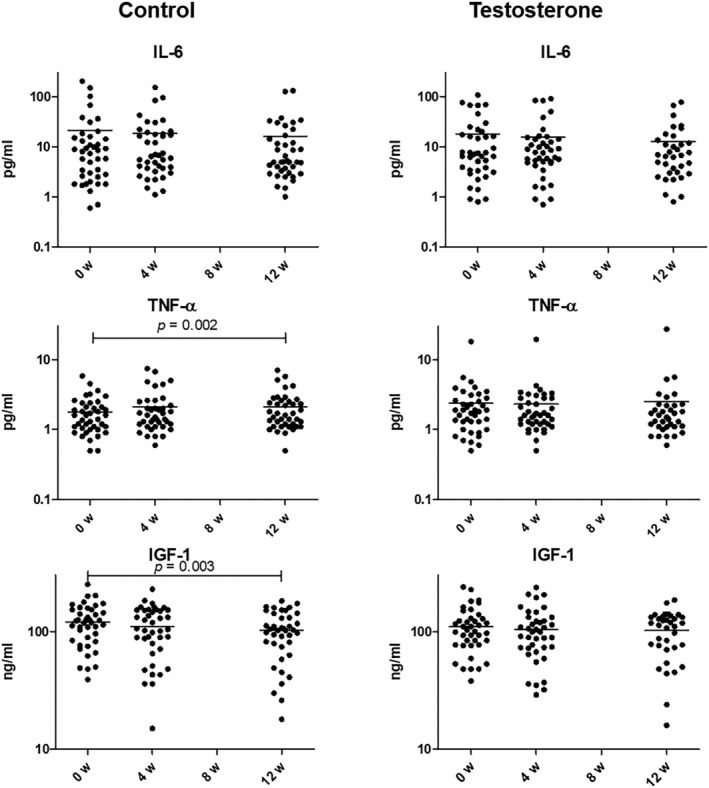
Figure 3.

The changes of cachexia‐related serum proteins in the control and testosterone groups. Chronological changes are shown in semi‐log plot. The number of patients included in the control and testosterone groups at baseline, weeks 4, and 12 were 41 and 40, 41 and 40, and 40 and 35, respectively. Data were analysed using paired t‐tests or Wilcoxon signed‐rank tests after the Shapiro–Wilk test. Horizontal bars indicate mean, values. IL‐6 = interleukin‐6; TNF‐α = tumour necrotic factor‐α; IGF‐1 = insulin‐like growth factor‐1.
