
Figure 4.
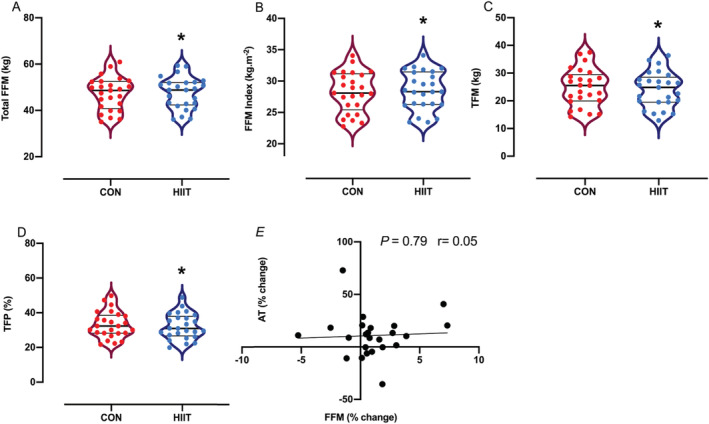
(A–D) Violin plots represent a full distribution of raw data (dots), median (central line), and interquartile range (lower and upper lines) of body composition after a control period (CON) and after high‐intensity interval training (HIIT). (E) Correlation between fat‐free mass (FFM) and anaerobic threshold (AT) changes with HIIT. Abbreviations: TFM, total fat mass; TFP, total fat percentage. Analysis via paired Student's t tests. * P < 0.05 vs. CON.