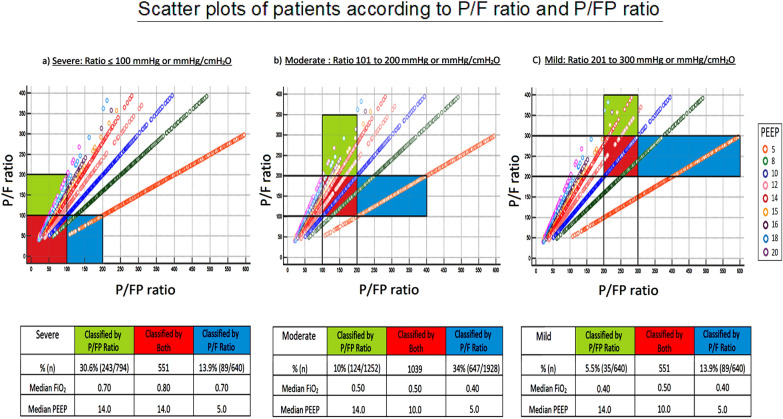
Fig. 2.
Scatter plots of patients according to P/F ratio and P/FP ratio. Each circle represents individual patients on a certain applied PEEP; each colour represents a different PEEP setting. Green bars represent patients who were classified by the P/FP ratio in each severity. Blue bars represent patients who were classified by the P/F ratio in each severity. Red bars represent patients whose categories remained unchanged. Definition of abbreviations: FiO2 = fraction of inspired oxygen; PEEP = positive end-expiratory pressure; P/F = ratio of the partial pressure of arterial oxygen (PaO2) to FiO2; P/FP = (PaO2 * 10)/(FiO2 * PEEP)

