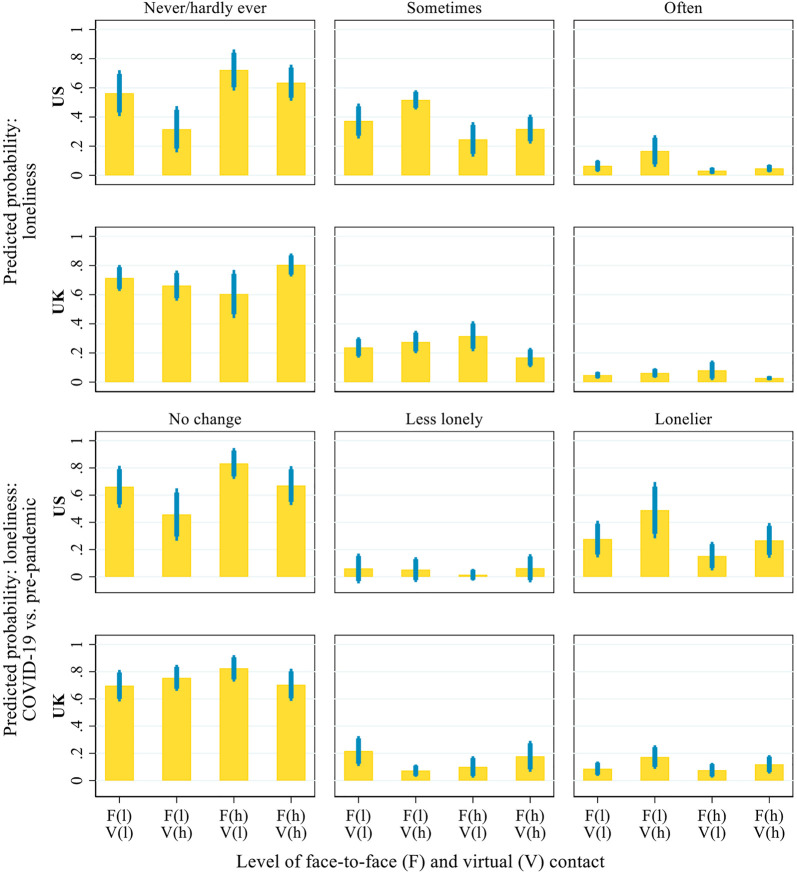
FIGURE 7.
Predicted probability of loneliness during the COVID-19 pandemic and its changes from before the pandemic, by the interaction of inter-household face-to-face and virtual contact. Notes: Thick error bars indicate 90% confidence intervals and thin error bars indicate 95% confidence intervals. In the brackets on the x-axis, ‘l' = low level (i.e. 2 standard deviations below the mean) and ‘h' = high level (i.e. 2 standard deviations above the mean). Predictions based on the models presented in Supplementary Table S5, controlling for all covariates presented in Table 1.

