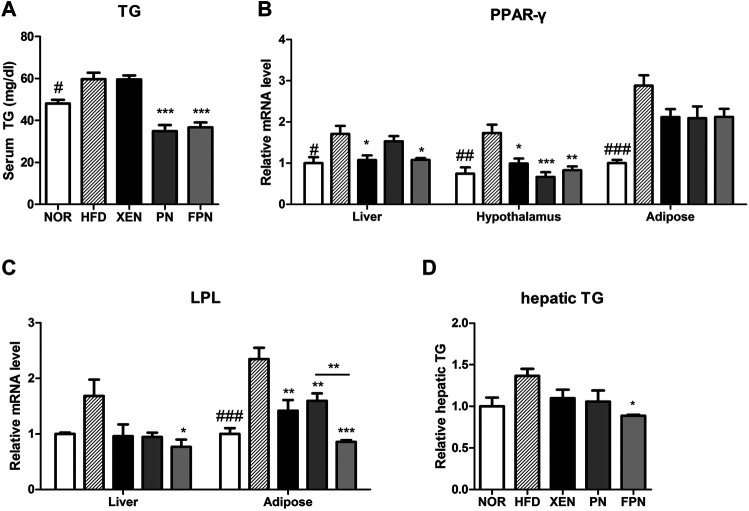
FIGURE 4.
Effect of PN and FPN on the lipid metabolism of HFD-induced mouse model after treatment for 9 weeks. The TG was measured in (A) serum and (D) liver. The expression of the genes of interest in the liver, hypothalamus, and adipose tissue was determined by RT-PCR. The relative gene expressions of (B) PPAR-γ and (C) LPL which play an important role in lipid metabolism were measured. The data are expressed as the mean ± SEM (n = 7–8); #p < 0.05; ###p < 0.001; NOR vs. HFD group. *p < 0.05; **p < 0.01; ***p < 0.001; HFD group vs. treatment groups (XEN, PN and FPN).

