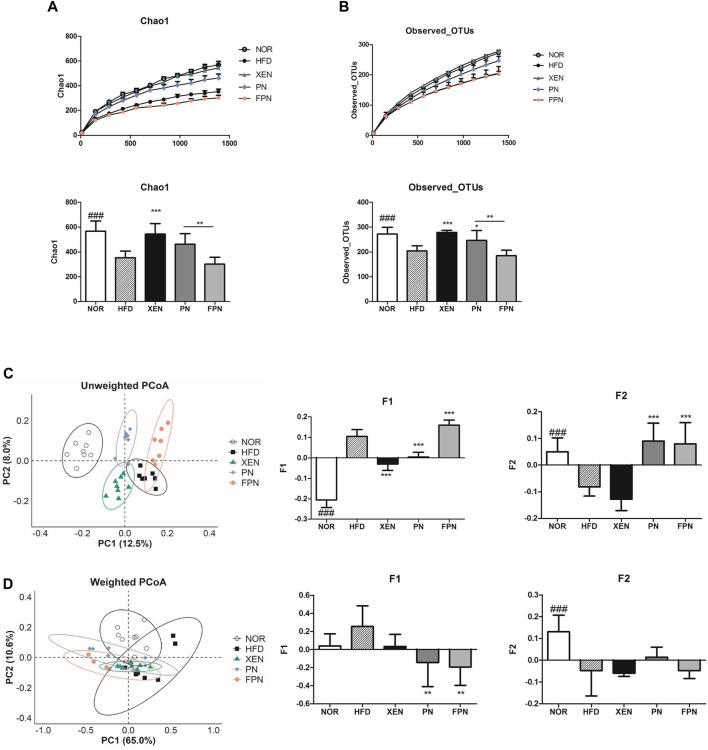
FIGURE 7.
Changes in the diversity and structure of the gut microbiota in response to exposure to PN or FPN in the HFD-induced mouse model. The alpha diversity was measured from (A) Chao 1 and (B) observed OTUs. PCoA score plot calculated from OTU level by QIIME was subjected to (C) unweighted and (D) weighted UniFrac analysis. The data are expressed as the mean ± SEM (n = 7–8); ###p < 0.001; NOR vs. HFD group. *p < 0.05; **p < 0.01; ***p < 0.001; HFD group vs. treatment groups (XEN, PN and FPN).

