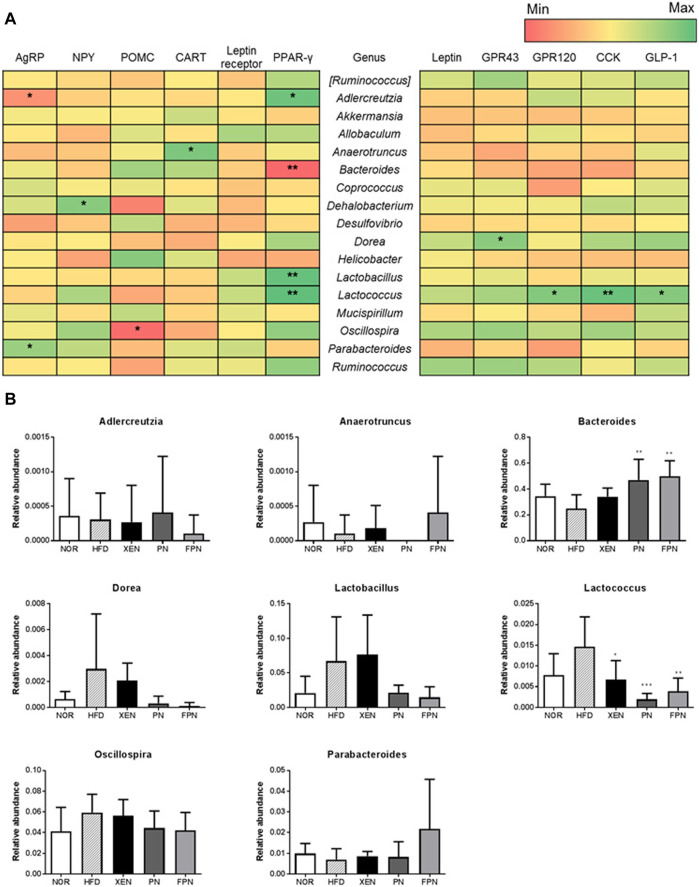
FIGURE 9.
Correlation between the gut microbiota and hypothalamic and colonic gene expressions of the satiety hormone leptin, appetite regulators, and gut hormones in the HFD-induced mouse model after a treatment for 9 weeks. (A) Heatmap showing the correlation between the gut microbial population at the genus level and the expression levels of genes of appetite regulators and gut hormones. The Pearson correlation values were used for the matrix. *p < 0.05; **p < 0.01; ***p < 0.001. (B) The relative abundance of the bacterial genus correlated significantly with the gene expressions in the hypothalamus and colon. The data are expressed as the mean ± SEM (n = 7–8); *p < 0.05; **p < 0.01; ***p < 0.001; HFD group vs. treatment groups (XEN, PN and FPN).

