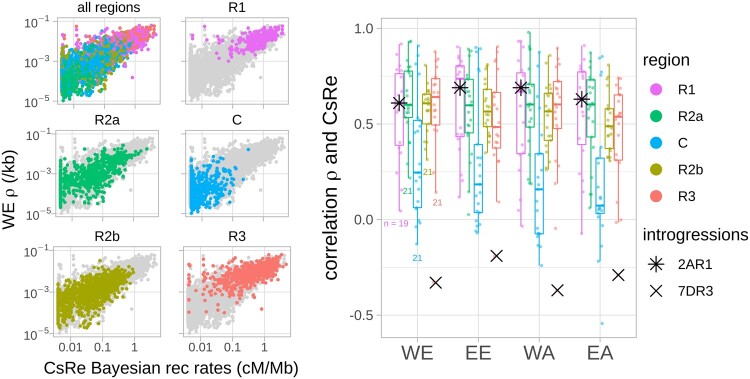
Fig. 3.
Similarity between LD-based recombination rates and CsRe meiotic recombination rates. Left: Genome-wide relationship between the CsRe biparental population meiotic recombination rates and the LD-based recombination profile of a Western European (WE) bread wheat population. Dots represent the recombination rates averaged within 4 Mb windows. Graphs R1, R2a, C, R2b, and R3 gather recombination rates within the five chromosomic regions defined by Choulet et al. (2014) (R1 and R3 are telomeric regions, R2a and R2b are pericentromeric regions, and C are centromeric regions) of all of the 21 chromosomes (1A, 1B, 1D … 7A, 7B, 7D) of bread wheat. Right: Correlation of LD-based and CsRe recombination rates for each landrace population within each genomic region (1AR1…7DR3). Dots represent correlation coefficients of recombination profiles (once averaged within 4 Mb windows) per genomic region and population. Small colored numbers indicate the number of correlation coefficients per boxplot. In principle, each boxplot should contain 21 dots (as many as chromosomes). However, two R1 genomic regions smaller than 20 Mb are not included (4DR1 and 7BR1), because of low robustness of their correlation coefficients (computed on less than five data points). Stars (* and x) represent genomic regions including well documented introgressions in CsRe population.

