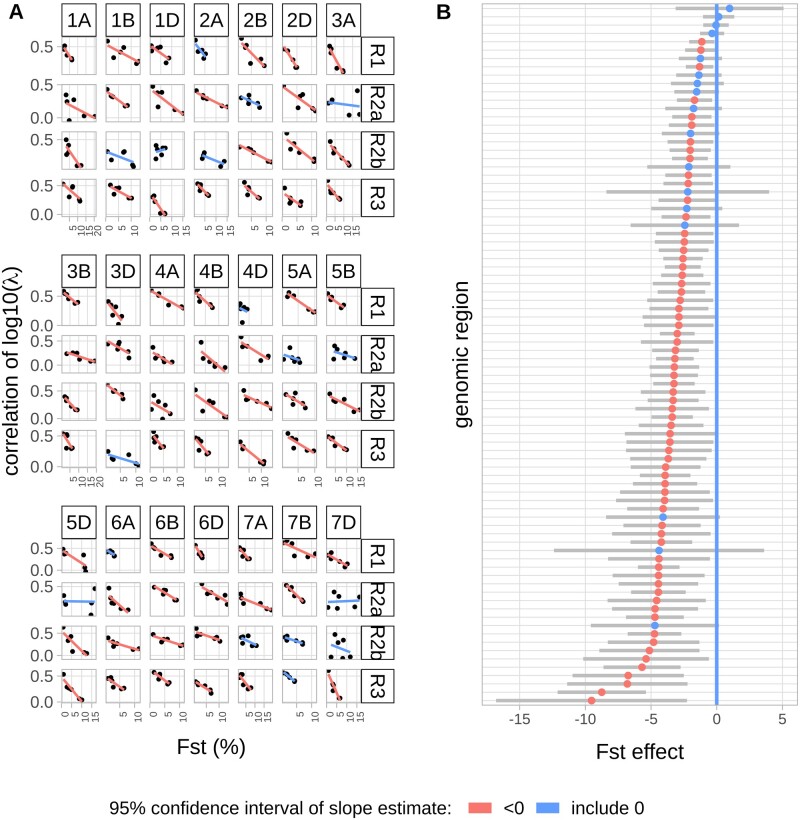
Fig. 6.
Relationships between correlation of local recombination intensity and FST per genomic region. (A) Relationship per genomic region. The slopes values are estimated by linear regression and gives the FST effects on the correlation of recombination profiles. (B) Ranked slope estimates (colored points) and their 95% confidence interval (gray bar). Blue color represents slopes with a confidence interval overlapping 0 and red color confidence interval not overlapping 0.

