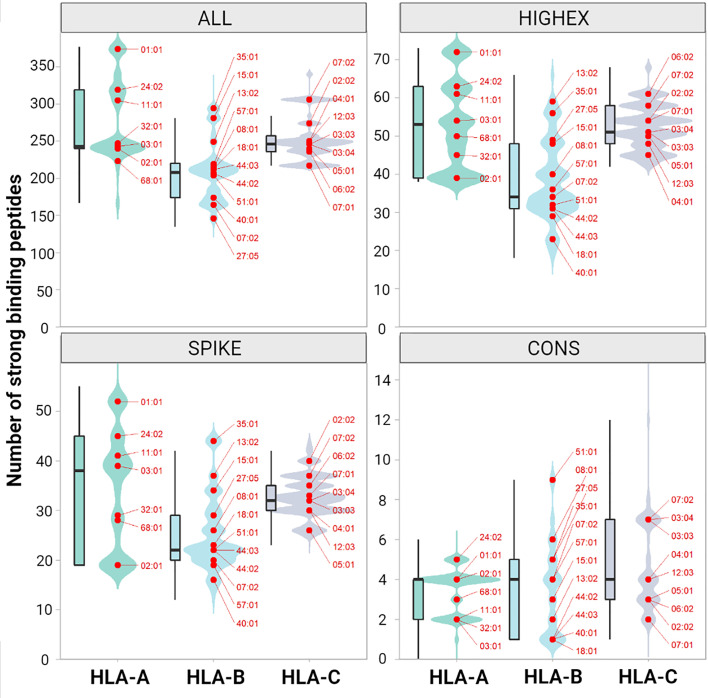
Figure 4.
Numbers of predicted immunogenic peptides per HLA class I molecule. The figure shows the distribution of the number of binding peptides across all patients and both alleles for HLA-A, -B and -C. The distribution is shown both as kernel density plot and as boxplot for peptides derived from the entire peptidome (ALL, upper left panel), from highly expressed proteins (HIGHEX, upper right panel), from the spike glycoprotein (SPIKE, lower left panel) and from conserved regions (CONS, lower right panel). The most common alleles are highlighted as red dots. The ranks of the most common allotypes reflect their capacity to present immunogenic peptides of the respective peptide pool, whereas the relative amplitude reflects the frequencies of all allotypes with this specific capacity in the population. Changes in the ranks of the allotypes reflect a polarization of the respective peptide pools.

