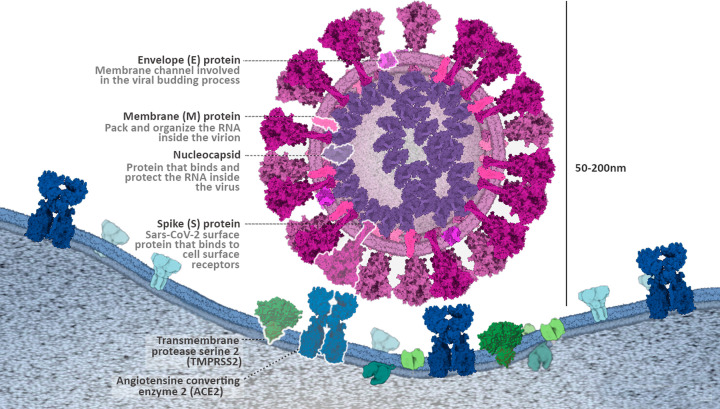
Figure 1. Structure of SARS-CoV-2.
Schematic representation of the SARS-CoV-2, and its interactions via surface proteins with target cells. Image adapted from the educational portal of RCSB PDB (PDB-101). Image created by Marta Palma Rodríguez (Graduate Student, Hospital General Universitario de Valencia).

