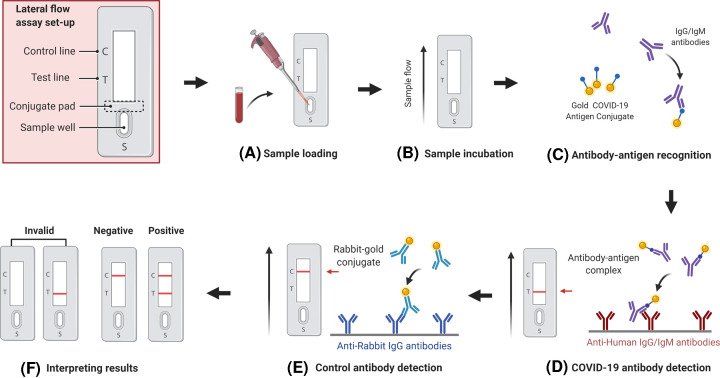
Figure 6. Schematic illustration of an LFA-based RDT biosensor for SARS-CoV-2 antibody (IgM–IgG) detection in blood samples.
Image shows sample loading, incubation, antigen–antibody reaction, and development of colored product (lines) for easy interpretation of assay result (A–F). Incubation allows the capillary action to move sample antibodies (IgG/IgM) forward towards conjugate pad where sample antibodies interact and form complexes with AuNP-coated antigens that are next immobilized by anti-human IgG/IgM antibodies and displayed as test and control red lines. Image adapted from reference [103] with permission from PeerJ under Creative Commons Attribution License.

