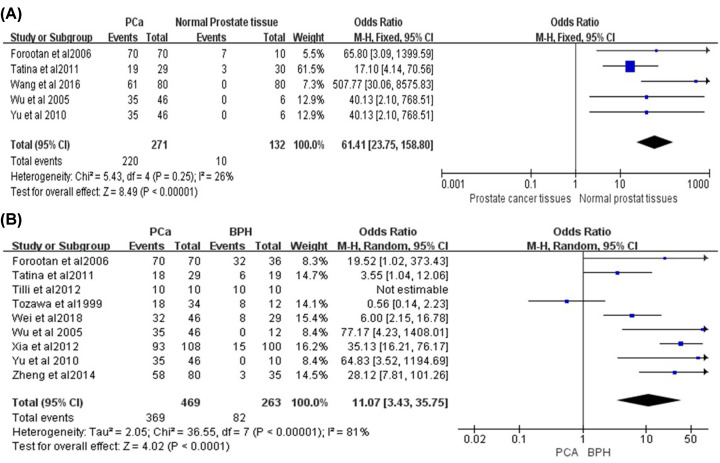
Figure 3. The forest plot of the expression of OPN and different prostate tissues.
(A) OPN positive expression in PCA tissues and normal prostate tissues. The result showed that OPN in PCA tissues was significantly higher than that in normal PCA tissues (OR = 46.55, 95% CI [12.85, 168.59], P<0.00001). (B) OPN positive expression in prostate cancer tissues and BPH tissues. The result showed that OPN in prostate cancer tissues was significantly higher than that in BPH tissues (OR = 11.07, 95% CI [3.43, 35.75], P<0.0001).

