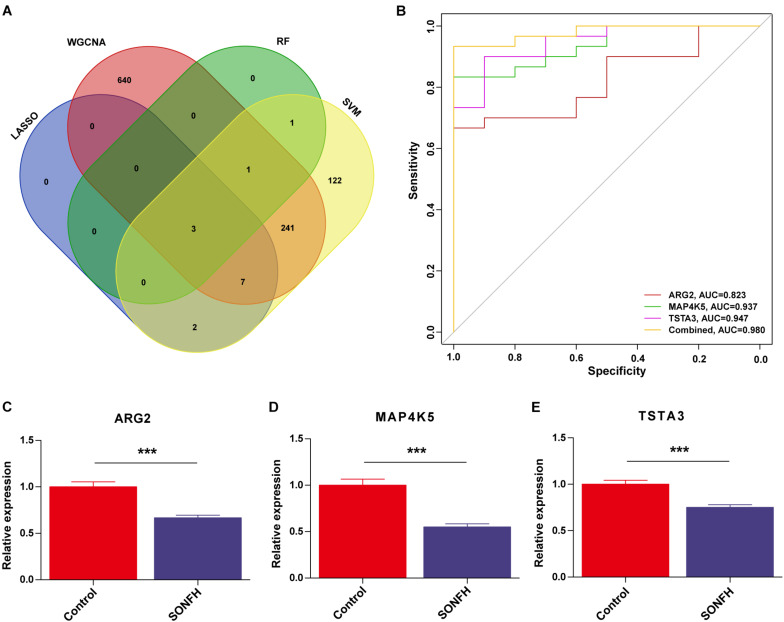
FIGURE 6.
(A) Venn diagram showed the intersection of diagnostic markers obtained by the four algorithms. (B) The ROC curve of the diagnostic efficacy verification after fitting three diagnostic markers to one variable. (C–E) Validation of the expressions of potential diagnostic markers via qRT-PCR. *P < 0.05; **P < 0.01, ***P < 0.001.

