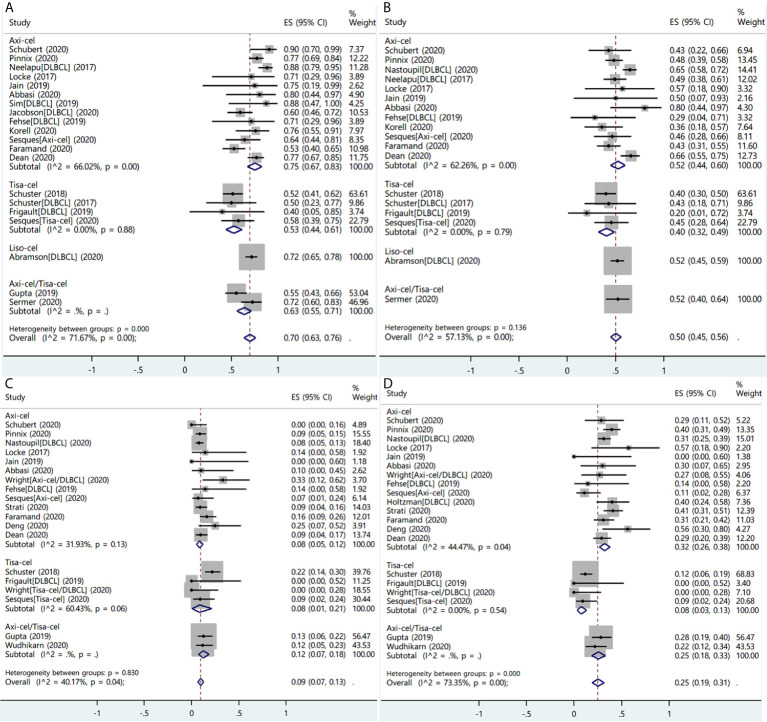
Figure 6.
The forest plots of pooled results in patients with diffuse large B-cell lymphoma. (A) The forest plot of overall response rate of each product. (B) The forest plot of complete response rate of each product. (C) The forest plot of severe cytokine release syndrome rate of each product. (D) The forest plot of severe immune effector cell-associated neurotoxicity syndrome rate of each product.

