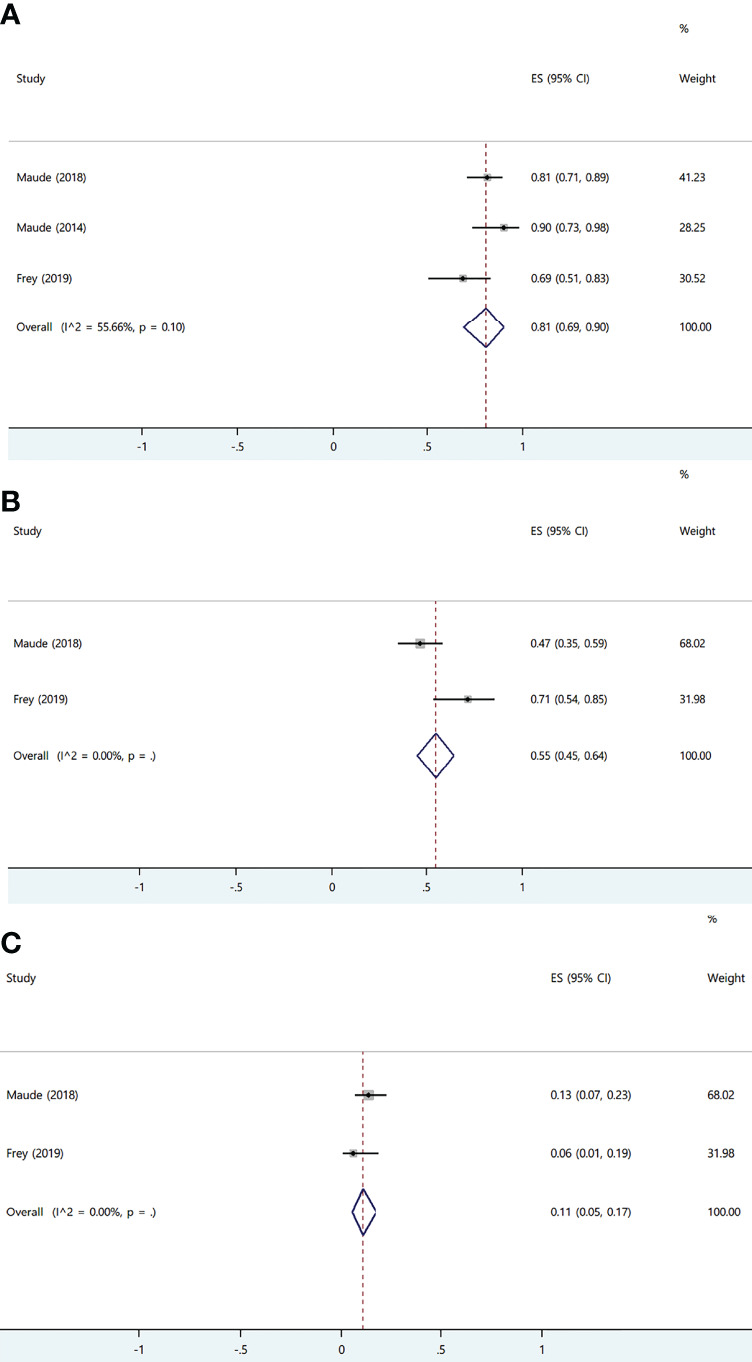
Figure 8.

The forest plots of pooled results in patients with acute lymphoblastic leukemia. (A) The forest plot of complete response rate of tisa-cel. (B) The forest plot of severe cytokine release syndrome rate of tisa-cel. (C) The forest plot of severe immune effector cell-associated neurotoxicity syndrome rate of tisa-cel.
