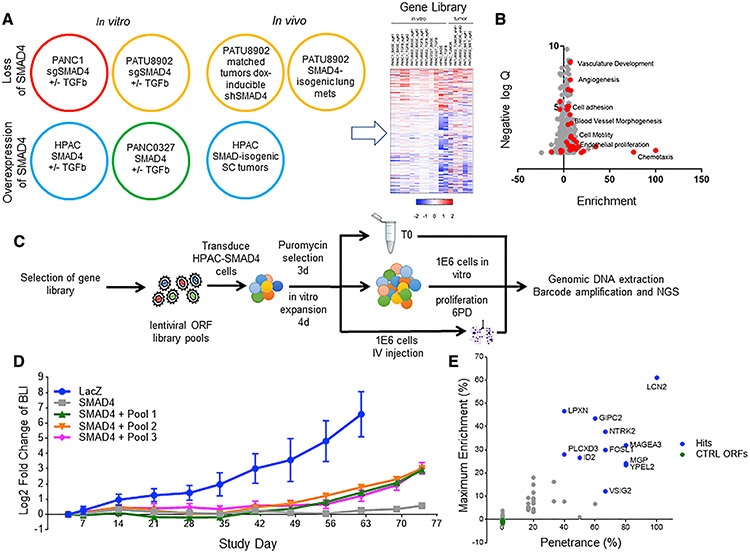
Figure 2. Gene overexpression metastatic colonization screen.
(A) Schematic of RNA sequencing (RNA-seq) conditions. RNA-seq was performed on SMAD4 isogenic pancreatic cell lines treated with or without TGF-β and tumors formed by SMAD4 isogenic pancreatic cells. The heatmap summarizes significantly differentially regulated gene expression through multi-component RNA-seq analysis; see Table S3.
(B) A volcano plot depicting the GO groups enriched in the up (positive) and down (negative) SMAD4-related genes. Red dots signify metastasis-related gene ontologies.
(C) Schematic of ORF library in vivo metastasis screen. ORF library transduced SMAD4-expressing HPAC cells are split into one of three arms, i.e., (1) pre-injection T0 cell pellet, (2) in vitro proliferation for six population doublings, and (3) i.v. inoculation into immunodeficient mice, to screen for genes that promote metastatic colonization to the lung, which is completely suppressed in the SMAD4-expressing HPAC cell line.
(D) Longitudinal BLI in the chest of mice following i.v. inoculation of ORF library-transduced SMAD4-expressing HPAC cells (n = 6, standard deviation is reported in error bars).
(E) Summary of in vivo pooled screen. The x axis shows penetrance, which was calculated as (times each ORF was more than 5% of total tumor reads)/(number of mice in which the ORF was assessed). They axis shows maximum enrichment, which was calculated as (maximum percentage of ORF in any metastatic tumor) – (percentage of the ORF in pre-injection cell pellet). The same five negative control ORFs were included in each sub-pool and were not enriched in the metastatic tumors.

