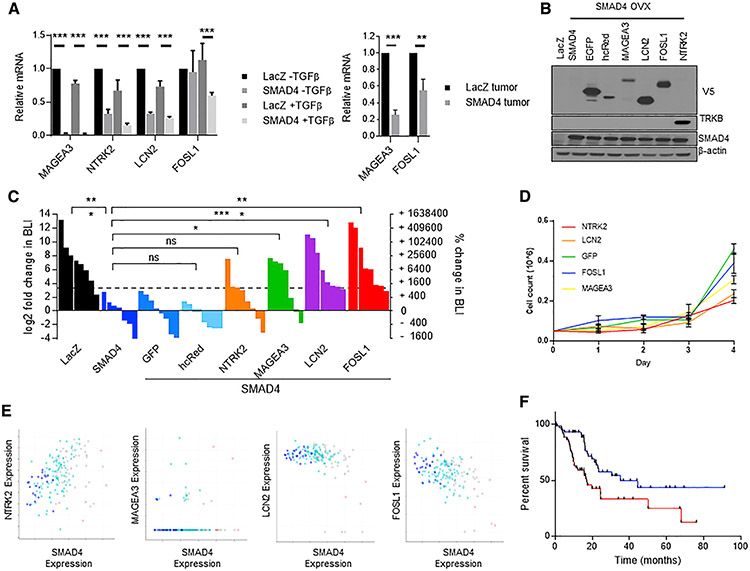
Figure 3. Arrayed validation of candidate genes from the pooled metastasis screen.
(A) (Left) qRT-PCR of LacZ- and SMAD4-expressing HPAC cells treated 8 h with TGF-β showing downregulation of MAGEA3, NTRK2, and LCN2 mRNA by SMAD4, and TGF-β-induced SMAD4-dependent downregulation of FOSL1 mRNA. (Right) qRT-PCR of LacZ- and SMAD4-expressing HPAC xenograft tumors showing downregulation of MAGEA3 and FOSL1 expression. Mean of three biological replicates is shown (t test, **p < 0.01, ***p < 0.001; standard deviation is reported in error bars)
(B) Overexpression of “hit” genes in HPAC-SMAD4 cells. All ORFs are V5-tagged except for NTRK2, which is immunoblotted with TRKB antibody.
(C) Waterfall plot and statistical summary of chest BLI at 10 weeks following i.v. inoculation (t test, *p < 0.05, **p < 0.01, ***p < 0.001).
(D) 2D cell culture growth rate of HPAC SMAD4 overexpression cells with overexpressed NTRK2, LCN2, FOSL1, MAGEA3, or GFP control. Time points were taken every 24 h during the course of 4 days. Cell count is reported (n = 3, error bars reflect standard deviation).
(E) Gene correlation graphs correlation of the hit genes NTRK2 (Pearson’s r = 0.37, p = 7.45e—7), MAGEA3 (Pearson’s r = 0.02, p = 0.762), LCN2 (Pearson’s r = −0.44, p = 2.12e—9), and FOSL1 (Pearson’sr= −0.48, p = 4.15e—11) in TCGA pan-cancer pancreatic cancer cohort with SMAD4. SMAD4 copy number status is indicated by point color (blue indicates homozygous deletion, light blue indicates heterozygous deletion, gray indicates diploid, and light red indicates gain).
(F) Kaplan-Meier overall survival analysis of TCGA Pancreatic Cancer cohort split by top third (red) and bottom third (blue) of FOSL1 expression (log-rank p = 0.0052).

