Figure 6.

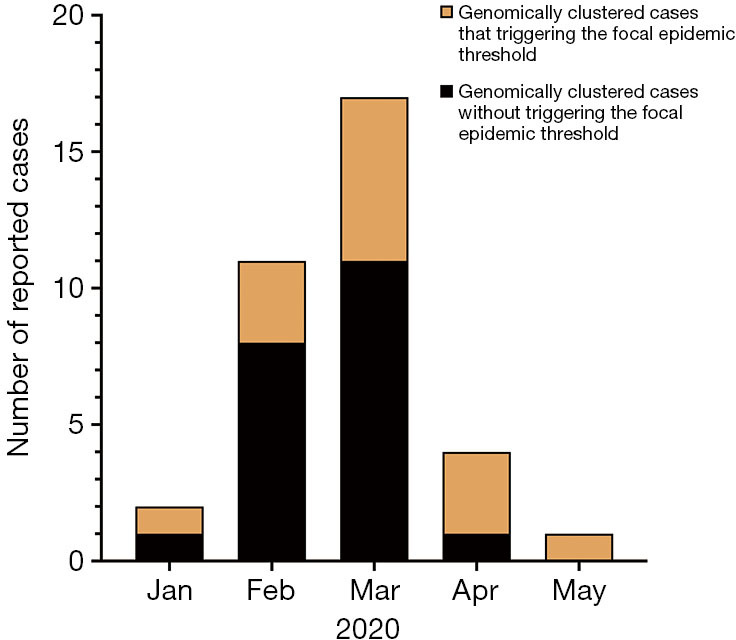
Spatial distribution and temporal distribution of cases from Cluster 1 (N=35). Different colors represent genomically clustered cases with or without triggering the focal epidemic threshold.

Spatial distribution and temporal distribution of cases from Cluster 1 (N=35). Different colors represent genomically clustered cases with or without triggering the focal epidemic threshold.