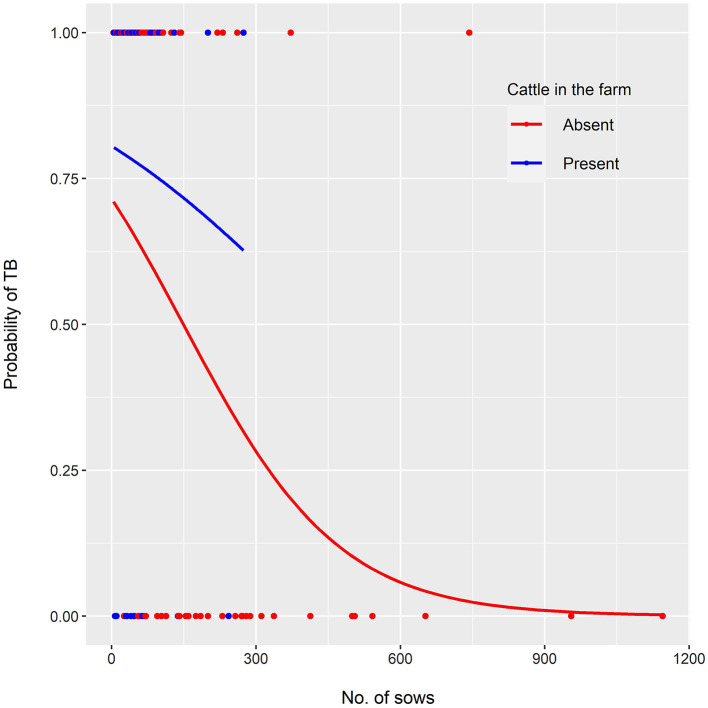
Figure 1.
Multivariable logistic model showing the probability of TB confirmation in TBL samples as a function of the number of sows in the farm of origin, when cattle were present or absent (red and blue lines, respectively). Dots along the x axis represent samples with (y = 1) and without (y = 0) TB confirmation, in farms where cattle were present (red) or absent (blue).

