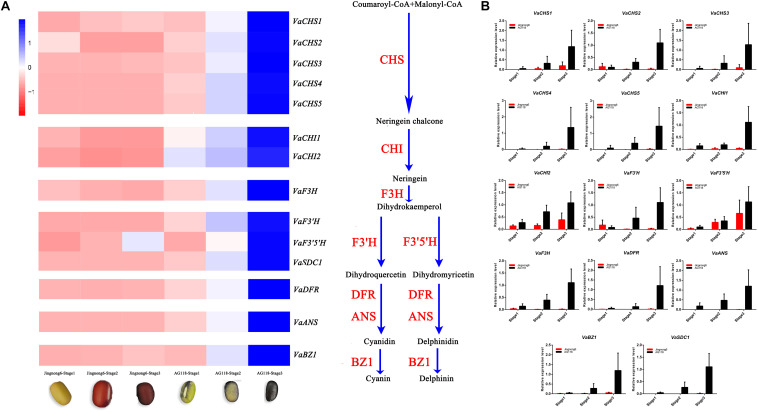
FIGURE 4.
Differences in gene expression levels of Jingnong6 and AG118 seed coats. (A) The expression profiles of flavonoid metabolic pathway structural genes in Jingnong6 and AG118 from stage 1 to stage 3 by RNA-Seq; (B) the expression profiles of structural genes of flavonoid metabolic pathways verified by qRT-PCR (mean ± SD from three biological replicates).

