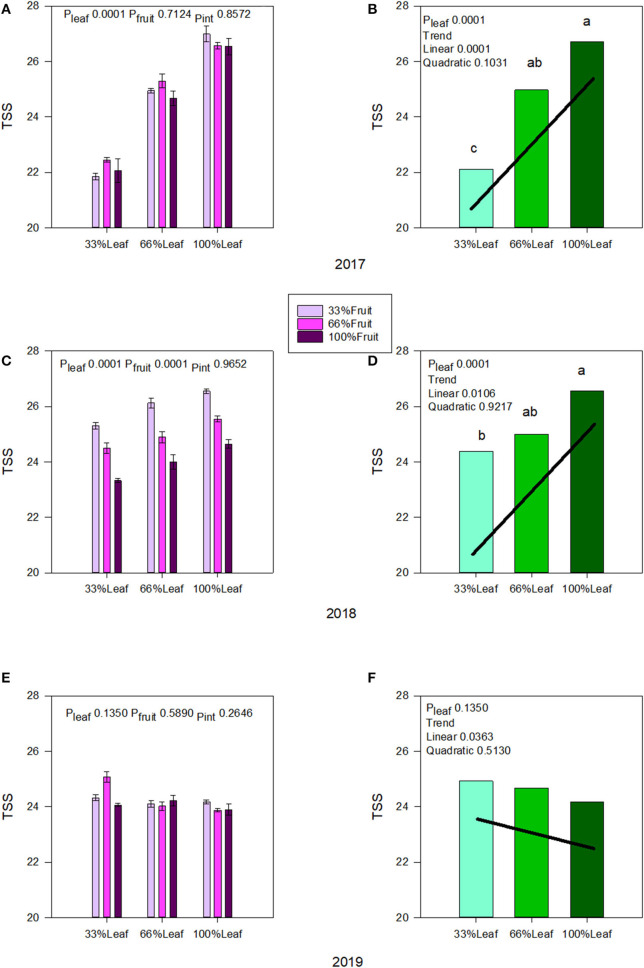
Figure 5.
Effect of defoliation and fruit removal on berry total soluble solids of Cabernet Sauvignon in 2017 (A,B); 2018 (C,D); and 2019 (E,F). The interactive effects and simple means with standard error of the mean in each year are presented in (A,C,E). The main effects of defoliation with significant trend lines are presented in (B,D,F). Columns with different letters in main effect panels are significantly different at P < 0.05 according to Tukey's HSD.

