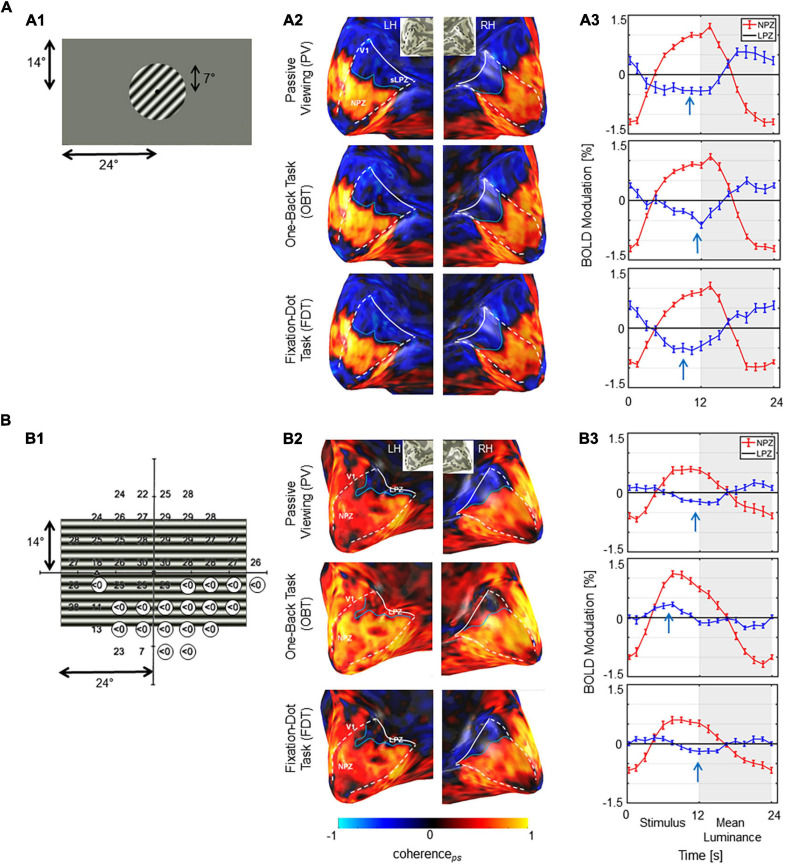
FIGURE 3.
Stimulus schematics and fMRI-based activations. (A) Control HC1 (A1) Illustration of stimulated visual field for the controls with the simulation of a scotoma by peripheral masking beyond 7°. (A2) BOLD-activations (coherenceps) for the three task conditions projected onto the inflated occipital lobe as false-color overlays. V1 boundaries (white dashed) and the anterior extent (white solid line) were determined from the participants pRF mapping; NPZ and LPZ are indicated. (A3) Average single-cycle BOLD time series for the three conditions in the NPZ (red) and LPZ (blue) ROIs. White and gray zones indicate motion and blank blocks, respectively. The induced BOLD response is shifted due to the hemodynamic delay. Stimulus related BOLD modulations in LPZ are negative, irrespective of the task condition, as indicated by the arrows. (B) Glaucoma participant GL1. (B1) Visual field sensitivities for the study eye (left eye SAP) as determined perimetrically are superimposed onto stimulus layout (absolute scotomas are highlighted by white discs). (B2) BOLD-activations (coherenceps) depicted as for A2. V1 was determined from the participants pRF mapping data informed by atlas mapping as detailed in section “Materials and Methods.”. (B3) Average single-cycle BOLD time series depicted as for A3. Depending on task, LPZ responses were negative (PV/FDT) or positive (OBT), as indicated by the arrows. NPZ, normal projection zone; LPZ, lesion projection zone; RH, right hemisphere; LH, left hemisphere.

