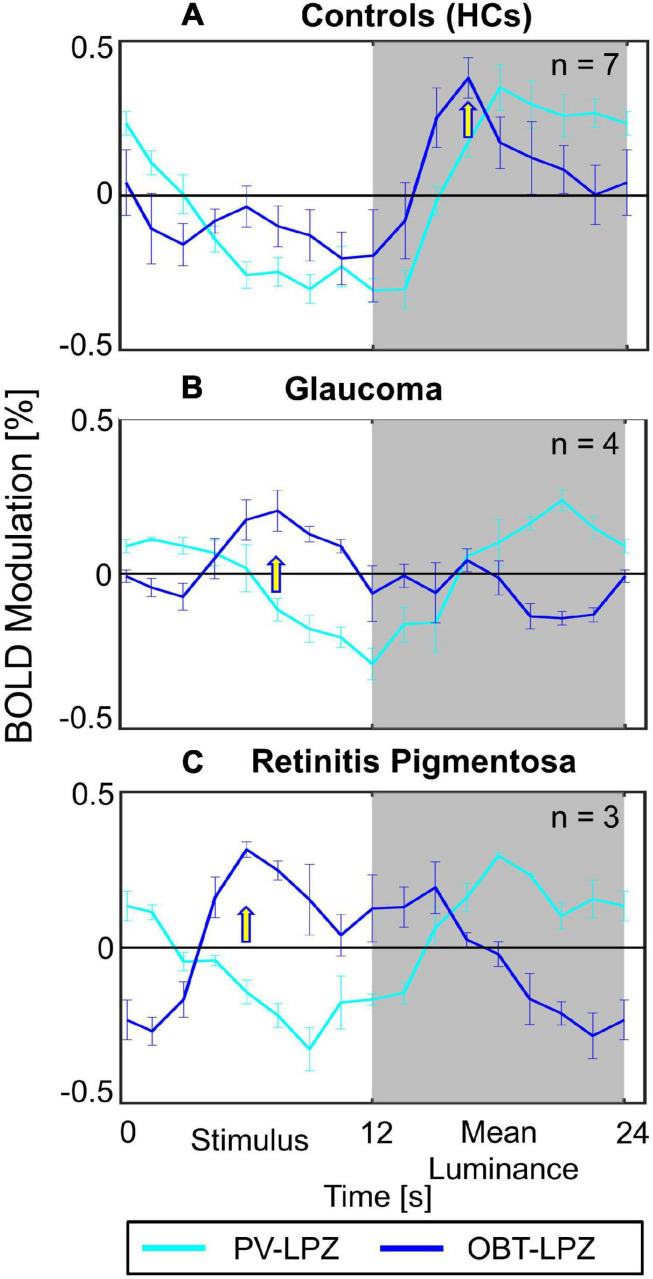
FIGURE 4.
Average single-cycle BOLD time series ± SEM. Group-averaged fMRI response modulation across participants of V1 LPZ during PV (cyan) and OBT (blue) conditions. The panels show the plots for (A) HCs (B) Glaucoma (C) Retinits Pigmentosa. Yellow arrows indicate time-points with peak responses for OBT; the BOLD-peak for OBT shifts from the second block (12–24 s) in HC to the first block (first 12 s) in RP and glaucoma.

