Figure 1.

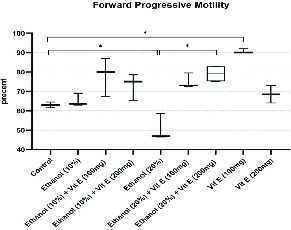
Comparison of the rate of forward progressive motility among the groups. Boxes depict the 25 and 75 percentiles with indication of the median and whiskers depict the 10 and 90 percentiles. *P 0.05.

Comparison of the rate of forward progressive motility among the groups. Boxes depict the 25 and 75 percentiles with indication of the median and whiskers depict the 10 and 90 percentiles. *P 0.05.