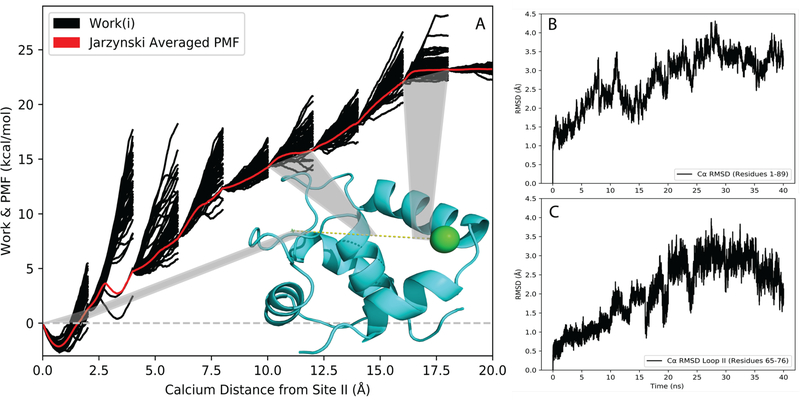
Figure 2.
Analysis of Ca2+-bound N-cTnC ASMD. (A) The PMF ofwildtype N-cTnC obtained at constant NPT using ASMD in 10 stages with 50tps, and a pulling speed of 0.5 Á/ns.The work traces W(£t’ )forthe 50 individual trajectòries in each stage are shown in thin black curves, and the PMF W obtained from the Jarzynski Equality is shown asa thin red curve. A representative structure ofWT N-cTnC [PDB 1AP4] is shown with the pulí path of calcium (dashed yellow line) and highlighted sections corresponding to specific ASMD stages. (B)The RMSDof Ca atoms of N-cTnC (residues 1–89) throughout the entirety of the Jarzynski Averaged trajectory. (C)The RMSD of Ca atoms of loop II N-cTnC (residues 65–76) throughout the entirety of the Jarzynski Averaged trajectory.

