
Figure 4. Next‐generation sequencing reveals immunometabolic reprogramming in human T cells on KD.
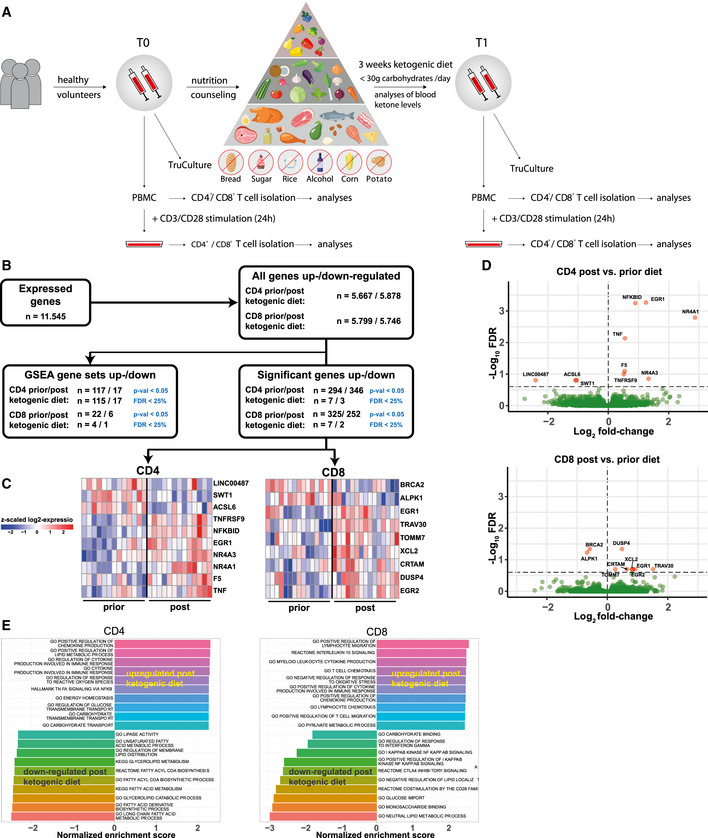
- Schematic study flow: 44 healthy volunteers conducted a 3‐week ketogenic diet (KD) with limited carbohydrate consumption of < 30 g/day. Blood was taken and analyzed before starting the diet (T0) and after 3 weeks of successful diet (T1). PBMCs were isolated. T‐cell stimulation was performed through CD3/CD8 Dynabeads at a bead:cell ratio of 1:8. CD4+/CD8+ T cells were separated via magnetic cell labeling.
- Total data set gene expression and differential regulation at the gene and pathway levels in human CD4+/CD8+ T cells prior to and post‐KD. Differential expression analysis was performed using DESeq2 while statistical significance was accepted for corrected P‐values (FDR) smaller than 25%.
- Heatmaps of z‐scaled expressions of significantly differentially expressed genes in CD4+ T cells (left) and CD8+ T cells (right) prior to and post‐KD. Red color indicates an upregulation post‐KD, and downregulated genes are indicated by blue color.
- Volcano plots visualizing differential gene expression T1/T0 in human CD4+/CD8+ T cells. Log2 fold‐changes (x‐axis) and −Log10 FDR (false discovery rate) corrected P‐values (y‐axis) are shown for each gene. The dashed horizontal line depicts the FDR threshold of 25%, significant genes in red.
- Gene set enrichment analysis. Shown are the top 10 upregulated and downregulated pathways ranked according to normalized enrichment score (NES).